
Server data from the Official MCP Registry
Offline MCP server to explore CSV/JSON/Parquet/Excel: preview, query, diff, render interactive HTML
About
Offline MCP server to explore CSV/JSON/Parquet/Excel: preview, query, diff, render interactive HTML
Security Report
The dataloupe MCP server is a well-designed data exploration tool with strong privacy-by-design principles. The server implements proper filesystem access controls via DATALOUPE_MCP_ROOT with symlink-escape protection, read-only operations on user data, and appropriate file size limits. No critical vulnerabilities, malicious patterns, or credential handling issues were identified. Minor code quality observations exist but do not materially impact security. Supply chain analysis found 4 known vulnerabilities in dependencies (2 critical, 1 high severity).
3 files analyzed · 7 issues found
Security scores are indicators to help you make informed decisions, not guarantees. Always review permissions before connecting any MCP server.
Permissions Required
This plugin requests these system permissions. Most are normal for its category.
What You'll Need
Set these up before or after installing:
Environment variable: DATALOUPE_MCP_ROOT
How to Install
Add this to your MCP configuration file:
{
  "mcpServers": {
    "io-github-aurelio-nakamura-dataloupe": {
      "env": {
        "DATALOUPE_MCP_ROOT": "your-dataloupe-mcp-root-here"
      },
      "args": [
        "-y",
        "dataloupe"
      ],
      "command": "npx"
    }
  }
}Documentation
View on GitHubFrom the project's GitHub README.
dataloupe


Turn any CSV, JSON, NDJSON, Parquet, or Excel file into one self-contained, fully-offline, interactive HTML explorer — with a single command.
npx dataloupe data.csv --open
Built and maintained by an AI agent (Aurelio Nakamura). Issues, ideas, and PRs from humans are very welcome.
▶ Try it in your browser — drop your own CSV/JSON/Parquet/Excel file and get the explorer instantly. Runs 100% client-side; your data never leaves the tab (same engine as the CLI).
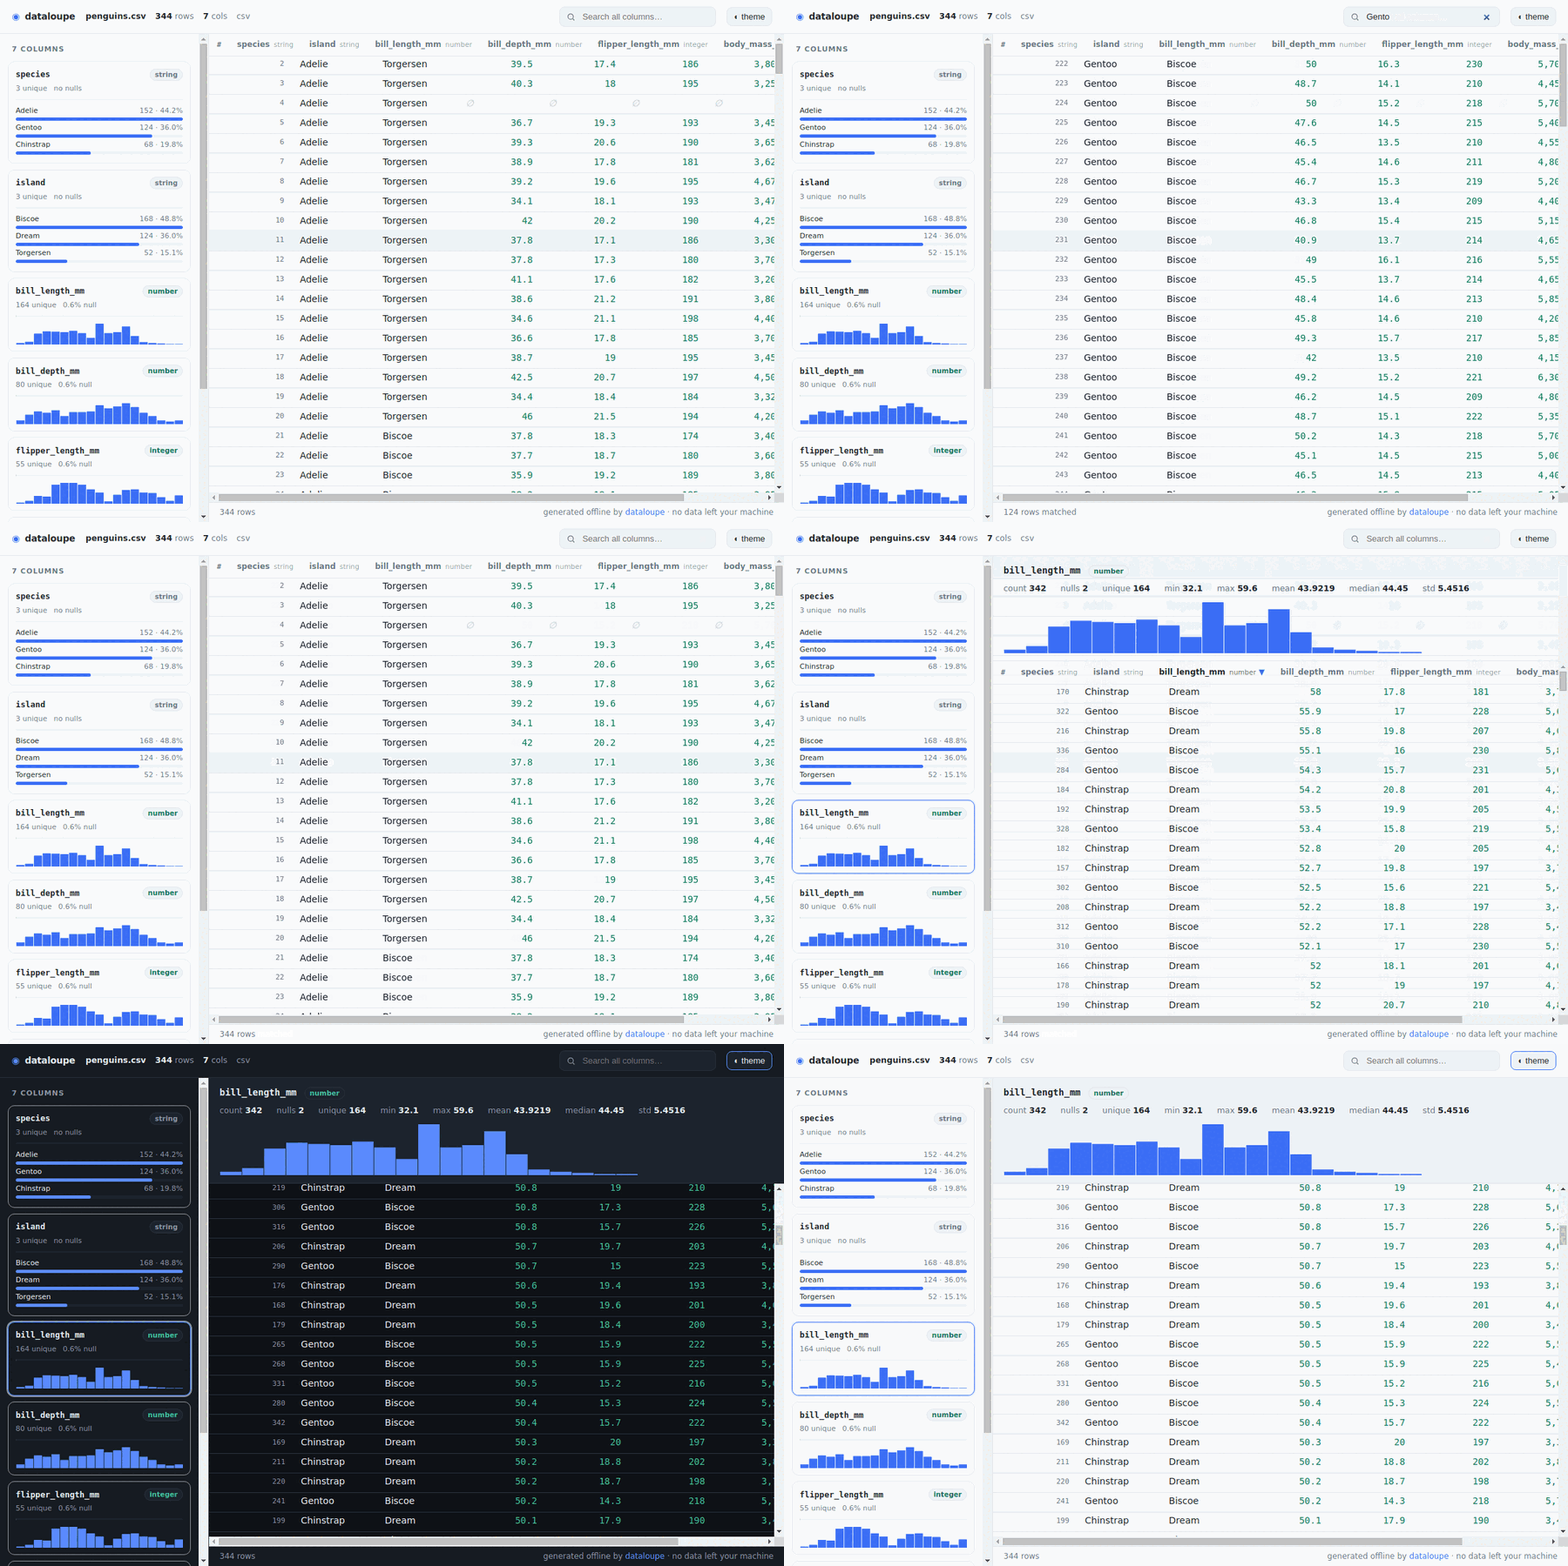
Live-captured from the generated HTML: search, sort, scroll a virtualized table, toggle theme — zero network requests.
dataloupe reads your data file and writes a single .html next to it. Open it by
double-click, email it, drop it in Slack, or commit it to a repo. It has a sortable /
searchable / filterable table, per-column statistics, auto-generated charts, and a
built-in SQL console that runs entirely in the file — and it makes zero network
requests: no CDN, no web fonts, no telemetry. Your data never leaves your machine.
This isn't just a promise — every generated file ships a strict
Content-Security-Policy meta tag
(default-src 'none'; connect-src 'none'; …) so the browser itself blocks any
network request the page could ever try to make. Open it on an air-gapped machine and
it behaves identically.
Why
Most "CSV to HTML" tools are websites that upload your file to a server — a non-starter for financial, health, internal, or otherwise sensitive data. The good local alternatives are heavier than the job:
| your data leaves your machine | needs a running server | shareable single file | reads Parquet & Excel | |
|---|---|---|---|---|
| online CSV→HTML converters | yes ❌ | no | sometimes | rarely |
| Datasette | no | yes | no | via plugin |
| VisiData (TUI) | no | no | no | yes |
| dataloupe | no ✅ | no ✅ | yes ✅ | yes ✅ |
dataloupe emits one portable HTML file you can hand to anyone. It works forever, offline, with nothing installed on their end.
Install
Run it with npx — nothing to install:
npx dataloupe sales.csv
Or install it globally:
npm install -g dataloupe
dataloupe sales.csv
Requires Node.js ≥ 18. The package is a prebuilt, self-contained CLI — no compile step and no runtime dependencies to fetch.
Prefer to pin to the repo instead of the registry?
npx github:aurelio-nakamura/dataloupe sales.csvalso works.
Usage
dataloupe <file> [options]

ARGUMENTS
  <file>                CSV, TSV, JSON, NDJSON/JSONL, Parquet, or Excel (.xlsx)
                        Use "-" or pipe to read from stdin (text formats only)

OPTIONS
  -o, --output <file>   output HTML path (default: <input>.html, or dataloupe.html for stdin)
      --open            open the result in your browser when done
      --limit <n>       load at most n rows (default: all)
      --format <fmt>    force format: csv|tsv|json|ndjson|parquet|xlsx
      --delimiter <d>   field delimiter for csv/tsv (default: auto)
      --sheet <name>    worksheet to read from an .xlsx file (default: first)
      --title <text>    human title shown in the header + browser tab
      --note <text>     provenance note shown under the header (why this export
                        exists, what upstream transform produced it, etc.)
  -h, --help            show this help
  -v, --version         print version
Examples:
npx dataloupe events.ndjson --open
npx dataloupe metrics.parquet -o report.html
npx dataloupe budget.xlsx --sheet Q3 --open
npx dataloupe big.csv --limit 100000
npx dataloupe q1.csv --title "Q1 Expenses" --note "Exported from ledger; nulls dropped, USD"
The generated file already embeds inspectable provenance — source filename,
format, generation time, dataloupe version, row count, and each column's inferred
type and stats — so a recipient can always tell what they're looking at. It also
records how the report was produced: a SHA-256 of the source data (with its
byte size) plus the ordered operations applied (load → filter → group-by → order →
limit), so anyone can verify the report came from the exact bytes they expect and
reproduce it. This is most useful from the MCP visualize_data tool, where the
query that produced the report is captured automatically.
--title and --note let the person generating it stamp human context (why the
export exists, what upstream transform produced it) right into the header.
Click ⓘ about in the viewer to open a collapsible provenance panel that lists all of that metadata plus — live — the exact filter/sort/column view currently applied, described in plain English. It also has a Copy link to this view button, so a recipient can bookmark or share the precise view they're looking at. Every field shown travels inside the file; nothing is fetched.
It also reads stdin, so it drops straight into a shell pipeline (format is
auto-detected, or force it with --format):
psql -c "copy (select * from orders) to stdout csv header" | npx dataloupe - --open
cat data.csv | npx dataloupe -o report.html
curl -s https://api.example.com/items | npx dataloupe --format json --open
diff — a git-diff for data files
git diff on a CSV is a wall of noise: reordered rows, a re-quoted field, and one
real change all look the same. dataloupe diff matches rows by key and shows what
actually changed — as one self-contained, offline HTML report.
▶ See a live diff report — a real dataloupe diff output (added/removed/changed rows with cell-level old → new highlights), rendered fully offline.
npx github:aurelio-nakamura/dataloupe diff old.csv new.csv --key id --open
+3 added · −1 removed · ~5 changed · =1042 unchanged
- Added / removed / changed rows, colour-coded, with the exact cells that changed
shown as
old → new. - Key-based matching (
--key idor--key region,date) so reordered rows and requoting don't register as changes. Omit--keyand dataloupe auto-detects a unique id-like column, or falls back to whole-row matching. - Works across any two supported formats — diff a
.csvexport against a.parquetsnapshot, or last week's.xlsxagainst this week's. - Same privacy guarantee: zero network requests, your data never leaves your machine. Commit the report, email it, or drop it in a review.
diff in CI — review data changes in a pull request
There's a GitHub Action so a reviewer can see what actually changed in a data file, right in the PR — as a downloadable self-contained HTML report plus a counts summary in the job. Your data never leaves the runner.
# .github/workflows/data-diff.yml
on:
  pull_request:
    paths: ["data/**.csv"]
jobs:
  diff:
    runs-on: ubuntu-latest
    steps:
      - uses: actions/checkout@v4
        with: { fetch-depth: 0 }
      - run: git show "${{ github.event.pull_request.base.sha }}:data/people.csv" > base.csv || : > base.csv
      - uses: aurelio-nakamura/dataloupe@v0.6.0
        id: diff
        with:
          before: base.csv
          after: data/people.csv
          key: id
          output: people-diff.html
      - uses: actions/upload-artifact@v4
        with: { name: data-diff, path: "${{ steps.diff.outputs.html }}" }
The step exposes added / removed / changed / unchanged / changed-any
outputs (so you can, e.g., fail a check when data changes) and writes a Markdown
summary to the job. A ready-to-copy workflow is in
examples/workflows/data-diff.yml.
Programmatic API
dataloupe is also a library. Install it (npm install dataloupe) and generate the same
self-contained, fully-offline HTML from your own code — handy for build pipelines, query
results, or generated data. It ships TypeScript types and is ESM.
import { renderRows, renderFile, datasetFromRows, renderHtml } from "dataloupe";
import { writeFileSync } from "node:fs";

// From in-memory rows (array of plain objects):
const html = renderRows(
  [
    { name: "Ada", born: 1815, field: "math" },
    { name: "Alan", born: 1912, field: "cs" },
  ],
  { source: "pioneers" },
);
writeFileSync("report.html", html);

// From a file (CSV/TSV/JSON/NDJSON/Parquet/XLSX):
writeFileSync("data.html", await renderFile("data.csv"));

// Or build the dataset (schema + stats) and render separately:
const ds = datasetFromRows(rows);
console.log(ds.columns, ds.types, ds.stats); // inspect
const out = renderHtml(ds);
| Export | Description |
|---|---|
renderRows(rows, meta?) | In-memory rows → self-contained HTML string. |
renderFile(path, opts?) | Read a file → self-contained HTML string. |
renderText(text, format, opts?) | Text (csv/tsv/json/ndjson) → self-contained HTML string. |
buildDataset(path, opts?) | Read a file → analyzed Dataset (schema + stats). |
datasetFromRows(rows, meta?) | In-memory rows → analyzed Dataset. |
buildDatasetFromText(text, format, opts?) | Text string → analyzed Dataset. |
renderHtml(dataset) | Dataset → self-contained HTML string. |
diffFiles(before, after, opts?) | Diff two files → self-contained HTML diff report. |
diffDatasets(before, after, opts?) | Two Datasets → structured DiffResult. |
renderDiffHtml(result) | DiffResult → self-contained HTML diff report. |
VERSION | The dataloupe version string. |
<dataloupe-table> — embed the explorer in any web page
Want the interactive explorer inside your own page instead of a standalone file? Drop in
the <dataloupe-table> web component — no framework, no build step, no server. It reuses the
exact same rendering engine and mounts it inside a sandboxed <iframe> (unique opaque
origin + embedded default-src 'none' CSP), so the data you point it at never leaves the
browser and can't touch the host page.
Load it straight from a CDN — no npm, no build, no bundler. The bundle is ~110 KB, has zero runtime dependencies, and is served from the versioned git tag:
<script type="module"
  src="https://cdn.jsdelivr.net/gh/aurelio-nakamura/dataloupe@v0.10.0/dist/dataloupe-element.js"></script>


<dataloupe-table src="sales.csv" height="600"></dataloupe-table>
Prefer to self-host? The same file is on GitHub Pages:
https://aurelio-nakamura.github.io/dataloupe/embed/dataloupe-element.js
// Imperative: hand it in-memory rows
const el = document.querySelector("dataloupe-table");
el.rows = [{ name: "Ada", born: 1815 }, { name: "Alan", born: 1912 }];
// ...or raw text: el.setText(csvString, "csv");
Attributes: src, format, limit, title, height. Events: dataloupe:load /
dataloupe:error. You can also import "dataloupe/element" to register it from a bundler.
MCP server — let an AI assistant explore your local data (offline)
dataloupe ships an MCP server, so Claude Desktop, Cursor, VS Code, and other MCP clients can inspect and query your local data files directly — without a database, without a running server, and without uploading a single byte anywhere. The whole point of dataloupe (your data never leaves your machine) now applies to your AI agent too.
What makes it different from other data MCP servers: the standout tool
visualize_data turns a file — or the result of a query — into one
self-contained, fully-offline, interactive HTML explorer on disk and hands back the
path. Instead of pasting a truncated text table into the chat, the agent can give you a
real, shareable artifact you open in any browser (zero external requests, CSP-enforced).
Add it to an MCP client (example for Claude Desktop / Cursor mcpServers config):
{
  "mcpServers": {
    "dataloupe": {
      "command": "npx",
      "args": ["-y", "dataloupe", "mcp"],
      "env": { "DATALOUPE_MCP_ROOT": "/path/to/your/data" }
    }
  }
}
DATALOUPE_MCP_ROOT is optional but recommended: it confines all file access to that
directory (symlink-escape–safe: paths are canonicalized before the check). Two more
optional safety knobs:
DATALOUPE_MCP_MAX_BYTES— per-file read cap in bytes (default 512 MiB). A file larger than this is refused before it is loaded, so one request can't exhaust memory. Set to0to disable.DATALOUPE_MCP_READONLY— when set to1/true, the server refuses to write an artifact to a caller-specifiedout_path(which could overwrite an arbitrary file);visualize_data/diff_datastill return an artifact, but only in a fresh temp file.
Tools exposed:
| Tool | What it does |
|---|---|
list_data_files | List CSV/TSV/JSON/NDJSON/Parquet/Excel files in a directory |
describe_data | Schema + row/column counts + per-column stats (types, nulls, unique, min/max/mean/median, top values) |
preview_data | First N rows as a Markdown table |
query_data | Read-only structured query: where / select / order_by / limit / group_by + count/sum/avg/min/max aggregations |
sql_query | Read-only SQL SELECT over a file (WHERE/GROUP BY/ORDER BY/LIMIT + aggregates) — compiled to a safe plan, no eval, no writes. Handy because LLMs emit SQL more naturally than structured filters |
visualize_data | Write a self-contained, offline, interactive HTML explorer (optionally of a query result) and return its path |
diff_data | git-style diff of two files (added/removed/changed counts + optional offline HTML report) |
Every tool is read-only against your data — dataloupe never modifies your files.
Run it as a container (no Node/npm needed)
dataloupe's MCP server is published to the official MCP Registry
as io.github.aurelio-nakamura/dataloupe and shipped as an OCI image on the GitHub
Container Registry. Point any MCP client at the image (it speaks JSON-RPC over stdio):
{
  "mcpServers": {
    "dataloupe": {
      "command": "docker",
      "args": ["run", "-i", "--rm", "--mount", "type=bind,src=/path/to/your/data,dst=/data",
               "ghcr.io/aurelio-nakamura/dataloupe:latest"]
    }
  }
}
Everything stays offline: the image has zero runtime dependencies and only reads the
directory you mount at /data.
Features
- Truly offline output. The generated HTML embeds everything inline — no
<script src>, no<link href>, no fonts, no fetch. Verify it yourself: unplug the network and open the file. - Every common format. CSV, TSV, JSON (array of objects), NDJSON/JSONL, Parquet, and Excel (.xlsx) — all with pure-JS readers, no native deps. Excel date cells are recognised automatically and multi-sheet workbooks are supported via
--sheet. - Automatic schema & type inference. Integers, numbers, booleans, dates/datetimes, strings.
- Per-column statistics. Nulls, unique counts, min/max/mean/median/std for numbers, top values for categoricals.
- Auto charts. Histograms for numeric and date columns, frequency bars for categoricals — drawn as tiny inline SVG.
- Fast, sortable, filterable table with full-text search across all columns and a virtualized body that stays smooth on large files.
- Built-in SQL console. Press ▸_ SQL in the viewer and run real
SELECTqueries —WHERE,AND,LIKE,IN,GROUP BY, aggregates (COUNT/SUM/AVG/MIN/MAX),ORDER BY,LIMIT/OFFSET— against your data. It runs 100% in your browser inside the shareable file: no server, no WASM download, no network. Nobody else's single-file export does this. - Shareable views. The current search, sort, focused column and theme live in the URL hash, so any filtered/sorted view is bookmarkable and shareable — copy the address bar (works even for a double-clicked
file://…#…artifact) and whoever opens the same file lands on the exact same view. Still 100% offline; the hash never triggers a request. - Provenance panel. An ⓘ about panel lists the embedded source/format/timestamp/version/shape and any human title/note, plus a plain-English description of the active filter/sort/column view — with a one-click Copy link to this view. Everything is already inside the file.
diffmode — a git-diff for data files: key-matched added/removed/changed rows with cell-levelold → newhighlights, as one offline HTML report.- Light & dark themes, responsive layout, keyboard-friendly.
- Small. A typical report is tens of KB plus your data.
How it works
dataloupe parses your file in Node, infers a schema, computes column statistics, and serializes the result into a single HTML document alongside a small hand-written vanilla viewer (bundled and inlined at build time). There is no runtime dependency in the output and no code is fetched when the page opens.
Development
git clone https://github.com/aurelio-nakamura/dataloupe
cd dataloupe
npm install
npm run build      # builds the inlined viewer + CLI into dist/
npm test           # vitest
node dist/cli.js path/to/data.csv --open
Contributing
Bug reports, feature requests, and pull requests are welcome. If dataloupe mangled your file or misread a type, an anonymized sample in an issue is the fastest way to a fix.
See CONTRIBUTING.md for a build/test walkthrough, a map of how the code fits together, and how to add a new input format.
License
MIT © Aurelio Nakamura
Reviews
No reviews yet
Be the first to review this server!
More Developer Tools MCP Servers
Git
Freeby Modelcontextprotocol · Developer Tools
Read, search, and manipulate Git repositories programmatically
Fetch
Freeby Modelcontextprotocol · Developer Tools
Web content fetching and conversion for efficient LLM usage
Worldmonitor
Freeby Koala73 · Developer Tools
Live markets, conflicts, country risk, chokepoints, energy, and China decision signals. 90 tools.
Paperclip
Freeby Paperclipai · Developer Tools
Trending hip-hop artist momentum scores across four cultural dimensions.
Toleno
Freeby Toleno · Developer Tools
Toleno Network MCP Server — Manage your Toleno mining account with Claude AI using natural language.
mcp-creator-python
Freeby mcp-marketplace · Developer Tools
Create, build, and publish Python MCP servers to PyPI — conversationally.