
Server data from the Official MCP Registry
Search & edit Grafana dashboards, query datasources (PromQL/LogQL/SQL), inspect alerts.
About
Search & edit Grafana dashboards, query datasources (PromQL/LogQL/SQL), inspect alerts.
Security Report
Valid MCP server (2 strong, 2 medium validity signals). No known CVEs in dependencies. Package registry verified. Imported from the Official MCP Registry. Trust signals: trusted author (25/25 approved).
12 files analyzed · 1 issue found
Security scores are indicators to help you make informed decisions, not guarantees. Always review permissions before connecting any MCP server.
Permissions Required
This plugin requests these system permissions. Most are normal for its category.
What You'll Need
Set these up before or after installing:
Environment variable: GRAFANA_URL
Environment variable: GRAFANA_TOKEN
Environment variable: GRAFANA_MODE
How to Install
Add this to your MCP configuration file:
{
  "mcpServers": {
    "io-github-dockndevai-mcp-grafana": {
      "env": {
        "GRAFANA_URL": "your-grafana-url-here",
        "GRAFANA_MODE": "your-grafana-mode-here",
        "GRAFANA_TOKEN": "your-grafana-token-here"
      },
      "args": [
        "-y",
        "@dockndevai/mcp-grafana"
      ],
      "command": "npx"
    }
  }
}Documentation
View on GitHubFrom the project's GitHub README.
mcp-grafana


A safe-by-default Model Context Protocol server for Grafana. It lets an agent explore and operate Grafana — search dashboards, read the dashboard JSON model, list and query datasources (Prometheus / Loki / SQL), inspect alert rules and annotations, and (in higher modes) create/update dashboards and folders, write annotations, and delete.
Part of the dockndevai MCP server suite — one governance model across all of them.

What it gives an agent
The server starts read-only (see Safe by default); higher-capability tools are only registered when you raise the mode.
| Tool | For | Needs mode |
|---|---|---|
get_health | check the instance is up, version | read-only |
search | find dashboards & folders by name/tag (get UIDs) | read-only |
list_dashboards / list_folders | enumerate dashboards / folders | read-only |
get_dashboard | the full dashboard JSON model + meta | read-only |
list_datasources / get_datasource | datasources (secrets redacted) | read-only |
query_datasource | run PromQL / LogQL / SQL via the unified query API | read-only |
list_alert_rules | Grafana-managed alert rules | read-only |
list_annotations | events overlaid on graphs | read-only |
create_or_update_dashboard | upsert a dashboard (versioned, reversible) | read-write |
create_folder | create a folder | read-write |
create_annotation | mark a deploy/incident on graphs | read-write |
delete_dashboard / delete_folder / delete_annotation | delete (irreversible) | admin + GRAFANA_ALLOW_DELETE |
Install
npx -y @dockndevai/mcp-grafana
You need a Grafana service account token (Administration → Service accounts → Add service account → Add token). Give it the least role that works — Viewer for read-only use, Editor to create/update, Admin only if you must delete.
Configure
{
  "mcpServers": {
    "grafana": {
      "command": "npx",
      "args": ["-y", "@dockndevai/mcp-grafana"],
      "env": {
        "GRAFANA_URL": "http://localhost:3000",
        "GRAFANA_TOKEN": "glsa_...",
        "GRAFANA_MODE": "read-only"
      }
    }
  }
}
See docs/CLIENTS.md for Claude Code / Cursor / Codex / VS Code / Windsurf snippets, and .env.example for every supported variable.
Safe by default
The access model is enforced by src/security.ts — defence in depth on top of the service-account token's own role:
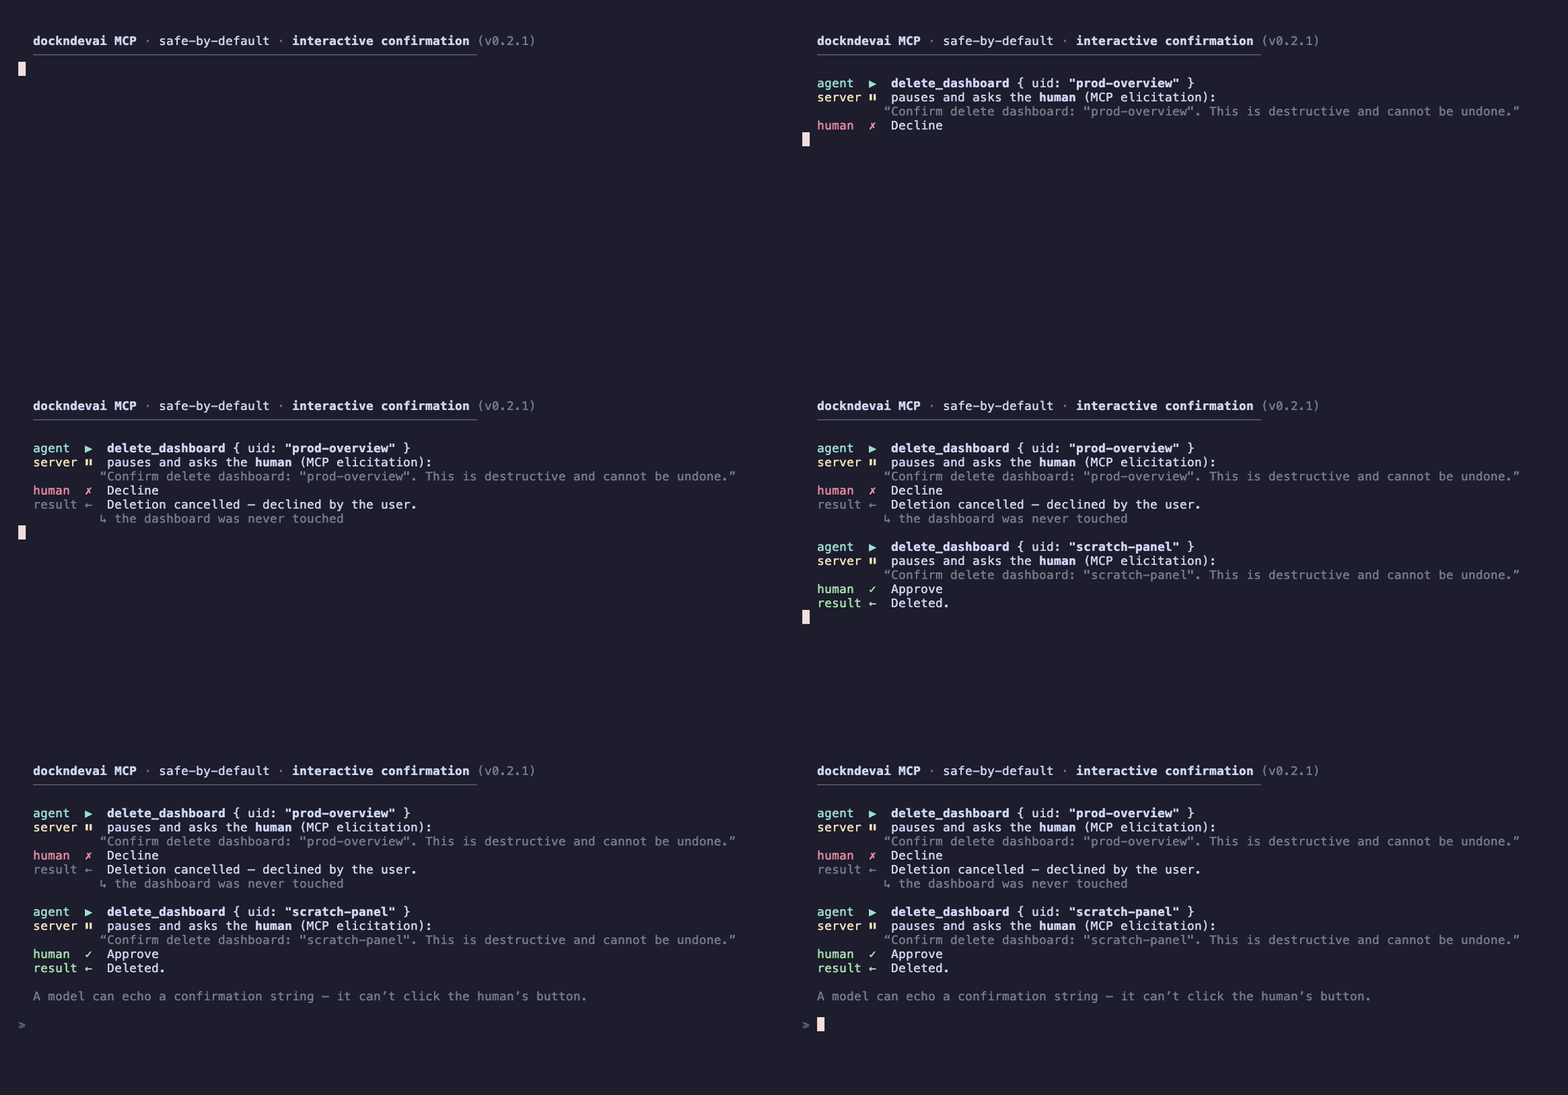
GRAFANA_MODE—read-only(default) →read-write→admin. A tool is registered only if the mode allows its capability. Read-only exposes the 11 read tools; edits needread-write; deletes needadmin.GRAFANA_ALLOW_DELETE— deletes are irreversible, so on top ofadminmode they also require this flag.GRAFANA_FOLDER_ALLOWLIST/GRAFANA_PROTECTED_FOLDERS— confine which folders can be written to; mark folders (e.g.production) that may be read but never modified or deleted.GRAFANA_DATASOURCE_ALLOWLIST— restrict which datasourcesquery_datasourcemay hit.GRAFANA_DRY_RUN— validate and log writes without executing them.GRAFANA_AUDIT_LOG— a JSON audit line per guarded operation, on stderr (default on).- Interactive confirmation — when the client supports MCP elicitation, deleting a dashboard/folder/annotation prompts the human to approve before it runs; clients that can't elicit fall back to the
GRAFANA_ALLOW_DELETEgate. - Secrets are never returned — datasource
secureJsonData, passwords and tokens are stripped from every response.
See SECURITY.md.
Working with dashboards & queries
Conventions for the dashboard JSON model, panel/target shapes, PromQL/LogQL/SQL query patterns, folder organisation and safe editing live in the bundled skill: .claude/skills/grafana-dashboards-and-queries/SKILL.md. Agents that load it can build and edit dashboards to a consistent standard without being re-taught each time.
Developing
npm install
npm run build
GRAFANA_URL=http://localhost:3000 GRAFANA_TOKEN=glsa_… node dist/index.js
# introspect without a live Grafana:
echo '{"jsonrpc":"2.0","id":1,"method":"tools/list","params":{}}' | GRAFANA_TOKEN=x node dist/index.js
Licence
MIT
Reviews
No reviews yet
Be the first to review this server!
More Data & Analytics MCP Servers
Toleno
Freeby Toleno · Developer Tools
Toleno Network MCP Server — Manage your Toleno mining account with Claude AI using natural language.
mcp-creator-python
Freeby mcp-marketplace · Developer Tools
Create, build, and publish Python MCP servers to PyPI — conversationally.
MCP Marketplace
Freeby mcp-marketplace · Developer Tools
Search and install MCP servers from inside your AI client.
MarkItDown
Freeby Microsoft · Content & Media
Convert files (PDF, Word, Excel, images, audio) to Markdown for LLM consumption
FinAgent
Freeby mcp-marketplace · Finance
Free stock data and market news for any MCP-compatible AI assistant.
Google Workspace MCP
Freeby Taylorwilsdon · Productivity
Control Gmail, Calendar, Docs, Sheets, Drive, and more from your AI