
Server data from the Official MCP Registry
Find out why a TypeScript project is slow: measured analysis and before/after comparison.
About
Find out why a TypeScript project is slow: measured analysis and before/after comparison.
Security Report
Valid MCP server (1 strong, 1 medium validity signals). No known CVEs in dependencies. ⚠️ Package registry links to a different repository than scanned source. Imported from the Official MCP Registry. 1 finding(s) downgraded by scanner intelligence.
5 files analyzed · 1 issue found
Security scores are indicators to help you make informed decisions, not guarantees. Always review permissions before connecting any MCP server.
Permissions Required
This plugin requests these system permissions. Most are normal for its category.
How to Install
Add this to your MCP configuration file:
{
  "mcpServers": {
    "io-github-musatoktas-whyts": {
      "args": [
        "-y",
        "whyts-mcp"
      ],
      "command": "npx"
    }
  }
}Documentation
View on GitHubFrom the project's GitHub README.
whyts


Find out why your TypeScript project is slow.
A small CLI that turns compiler diagnostics, traces, and import relationships into evidence you can act on. It says where the check is slow, and for three known patterns it also says why and what to do. No account, API key, or LLM required.
npx whyts
Run it in the folder of your tsconfig.json. It runs the real compiler once and prints at most three actions. To prove that a type change helped, use npx whyts compare (see below). To give the same evidence to an AI coding agent, use claude mcp add --transport stdio whyts -- npx -y whyts-mcp.
Found with whyts: a 7.4 s type check that went to 0.06 s (TanStack Form) and vue-tsc going from 80 s to 0.56 s (Vue). See Real cases.
Try it
Requires Node.js 20+ and a TypeScript project with dependencies installed.
npx whyts --project .
For repeatable runs, pin a version: npx whyts@0.8.4 --project .
To run from a checkout:
git clone https://github.com/musatoktas/whyts.git
cd whyts
npm ci --ignore-scripts
npm run demo
node src/cli.js --project /path/to/your/tsconfig.json
Diagnoses and remedies
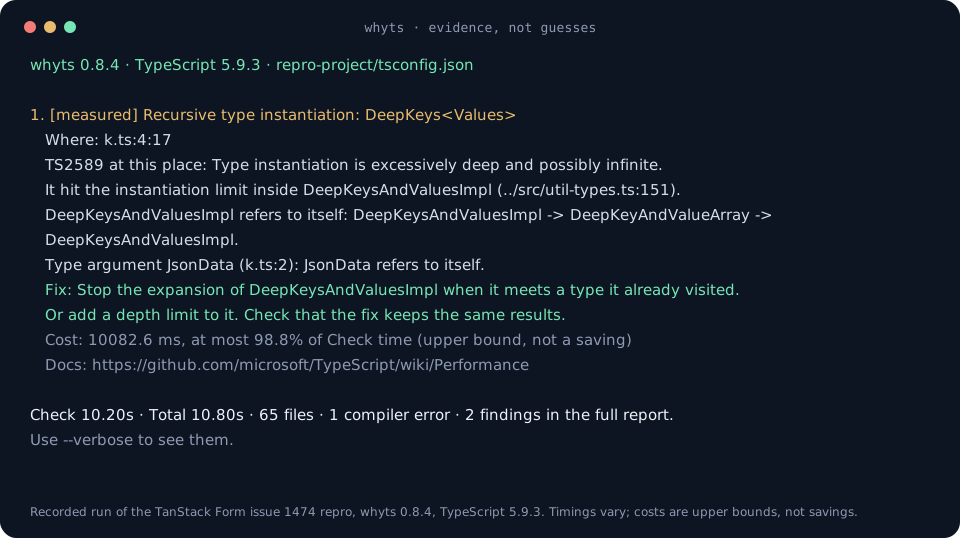
By default, whyts prints at most three actions and one summary line. Each action has a pattern, a location, a short remedy and a link. The image above is a recorded run. Use --verbose for the full report.
whyts 0.8.4 · TypeScript 5.9.3 · repro-project/tsconfig.json

1. [measured] Recursive type instantiation: DeepKeys<Values>
   Where: k.ts:4:17
   TS2589 at this place: Type instantiation is excessively deep and possibly infinite.
   It hit the instantiation limit inside DeepKeysAndValuesImpl (../src/util-types.ts:151).
   DeepKeysAndValuesImpl refers to itself: DeepKeysAndValuesImpl -> DeepKeyAndValueArray -> DeepKeysAndValuesImpl.
   Type argument JsonData (k.ts:2): JsonData refers to itself.
   Fix: Stop the expansion of DeepKeysAndValuesImpl when it meets a type it already visited. Or add a depth limit to it. Check that the fix keeps the same results.
   Cost: 10082.6 ms, at most 98.8% of Check time (upper bound, not a saving)
   Docs: https://github.com/microsoft/TypeScript/wiki/Performance

Check 10.20s · Total 10.80s · 65 files · 1 compiler error · 2 findings in the full report. Use --verbose to see them.
Three patterns have a remedy. Each one was seen in a real project before it was added.
| Pattern | Trace evidence | Remedy |
|---|---|---|
recursive-type-instantiation | A TS2589 error and the instantiateType_DepthLimit events. whyts finds the type alias that owns the type parameters at the limit, a reference cycle by name between aliases, and a type argument that refers to itself | Stop the expansion on a type that was visited, or add a depth limit |
variance-computation | getVariancesWorker events with the type id, the number of type parameters and the result. whyts reports the outermost events, the largest nested ones, and their union time | Reduce type parameters, simplify return types. An in or out annotation is not a guaranteed fix |
program-load | The program is big, and the check is not. The compiler counters (Total time, Check time, Memory used, parse and bind time) and the import graph. whyts reports the files from node_modules, the largest packages, the file that brings most of them, and the typeof import() references that bring them | Use a narrower entry point, or ask the maintainers of the package to move the references to an opt-in entry point. skipLibCheck does not help: it skips checking, not loading |
A program-load action looks like this (vuetify 4.2.4, a project that only has import { createVuetify } from "vuetify"; the lines are shortened):
1. [measured] Program load: 421 dependency files, vuetify has 407; Check time is 0.01s of 4.22s
   Where: ../node_modules/vuetify/lib/framework.d.ts:1:1
   The program has 480 files: 421 in node_modules (13.8 MB of source), 58 compiler library files and 1 of your own. ... Memory used 577 MB in the traced run.
   Largest packages by files: vuetify 407 (12 MB), @vuetify/v0 3 (0 MB), vue 2 (0 MB), ...
   409 of them (11.9 MB) come only through 218 typeof import() type references in ../node_modules/vuetify/lib/framework.d.ts, to ../node_modules/vuetify/lib/components/index.d.ts (192), ...
   Shortest import chain: index.ts -> ../node_modules/vuetify/lib/framework.d.ts -> ../node_modules/vuetify/lib/components/index.d.ts
   Fix: Each typeof import() reference in ... loads its target for every project that imports the package. Ask the maintainers to move them to an opt-in entry point. skipLibCheck skips checking these files, not loading them. ...
Rules:
- A diagnosis is
measuredwhen the compiler recorded it (the error or the trace events). The name-based walk over type aliases is syntax only: it can miss a cycle that runs through imports it cannot match by name, or through a type that is not a declaration of the program. - The variance pattern needs 100 ms of union time in total, and only events of 50 ms or more count. It lists only types declared in the project. A type from a dependency gets no remedy, because the project cannot change it.
- The cost is the largest recorded interval for the place, shown as at most N% of Check time. It is an upper bound under tracing. It is not a predicted saving.
- In the compact report, a slow check without a known pattern shows only above 3% of Check time. A check that a diagnosis already explains by type name is not listed twice.
- The trace events exist in TypeScript 5.9, 6.0 and 7.0 (
instantiateType_DepthLimit,getVariancesWorker). In TypeScript 7 they carry acheckerId, and whyts uses one checker, so the type ids stay unique. - The
program-loadpattern needs all of these: 200 files or more fromnode_modules, a Total time of 1 s or more, a Check time of at most 1 s and at most 10% of the Total time, and one file that alone brings 100 files or more (and 25% of the dependency files). The compiler library files and your own files do not count as dependency files. A project with a normal amount of its own code has a larger Check time and does not match. The counters come from the traced run, where Memory used is higher than in a plain run. program-loadis a measurement of the program, not of the check. It does not say that removing the files makes the check faster: the check time of such a program is already small. It readstypeof import('pkg')in declaration files as an import. A file that is also brought by a regular import is not counted as brought only by those references.- Remedies are short instructions. They name a direction. whyts did not measure any remedy on your project.
Real cases
whyts found the place in each case below. The fixes are open pull requests in those projects, so they are proposals until the maintainers merge them. The Vuetify row is a measurement in an issue, with no fix. Each number comes from my own measurement on the stated compiler version.
| Project | What whyts found | Result |
|---|---|---|
| tRPC (#6997) | TS2589 in Serialize (serialize.ts:35) when the type contains a recursive JSON type such as Prisma.JsonValue | A fix in PR #7660. The repro had TS2589 on main and has no error with the fix. Instantiations went from 89,700 to 78,502. The type-check time of packages/server did not change (within noise) |
| TanStack Form (#1474) | TS2589 in DeepKeys: the type alias refers to itself through DeepKeyAndValueArray | A fix in PR #2422. Check time of the repro went from 7.4 s to 0.06 s (whyts compare, 10 runs, separated). form-core stayed within noise |
| TypeORM (#8559) | TS2589 in QueryDeepPartialEntity (QueryPartialEntity.ts:17) for types that contain themselves | A fix in PR #12943. whyts reports the diagnosis before the change and reports none after it |
| Vue (#14323) | defineModel with a defineEmits call signature that ends in void makes OverloadUnionRecursive (@vue/shared) run to the depth limit. It is 100% of the Check time | A fix in PR #15851. vue-tsc with 1, 2 and 3 emits went from 31.1, 55.3 and 80.0 s to 0.42, 0.49 and 0.56 s (TypeScript 5.9.3). A component with 40 overloads and a model still hits TS2589, as it did before |
| Hono (#2399) | TS2589 in JSONParsed (src/utils/types.ts:53) with a recursive JSON type | A fix that stops at a visited type, in issue #5543. A depth limit made the .d.ts output 313,638 bytes; the fix keeps it at 762 bytes |
| node-redis (#2975) | 4.1 s of a 4.3 s check in one structural comparison of two RedisClusterType instantiations | Measurements from 4.7.0 to 6.3.0 in a comment |
| Vuetify (#23005) | One import { createVuetify } from "vuetify" makes a program of 480 files (tsc: Memory used 535,557K, Check time 0.01 s, Total time 2.56 s on 4.2.4). program-load names lib/framework.d.ts: its 218 typeof import() references (the GlobalComponents block among them) bring 409 of the 421 dependency files | The issue is open. No fix is proposed here. Emptying only the GlobalComponents block gave 111 files and Memory used 101,701K. That was a measurement of an upper bound, not a fix: it removes the global component types. Measured on 4.2.4 and TypeScript 5.9.3 |
What it finds
| Finding | Evidence | What it does not claim |
|---|---|---|
| Source check chains | Related expression/variable locations grouped by same-thread temporal nesting, inclusive chain duration, contained type comparisons with names and declaration locations | That nesting or a contained comparison proves the cause of a slowdown |
| Broad inclusion | Effective include and configured root count | That every broadly included file is unnecessary |
| Roots worth reviewing | Generated and output roots with no observed importers. Test and spec roots are only counted | That unimported files are safe to delete |
| Duplicate type versions | Multiple versions of an @types package loaded into the program | That all duplicate versions can safely be aligned |
| Barrel reach | Reexport count, importers, transitive file reach, reached files already configured as roots | Exclusive check cost, bundler behavior, or guaranteed savings |
| Slow file checks | Recorded checkSourceFile trace intervals | Complete attribution of total time or the exact expensive type |
| Compiler errors | The first five errors, the error code counts, and a warning when unresolved modules dominate | That the timings are valid when dependencies are missing |
| Recursive type instantiation | TS2589 location, the type alias at the instantiation limit, name-based reference cycles, self-referencing type arguments | That the listed cycle is the only cause |
| Variance computation | Outermost getVariancesWorker events for project types, nested types, union time | That a variance annotation removes the cost |
Findings are labeled measured, observed, or review. Measured source check chains appear first, with project code prioritized over dependencies. Chain spans below 10 ms and file spans below 100 ms remain in the recorded data without becoming findings. Structural suggestions follow in a separate section. Suggested changes require a fresh measurement and behavior checks. whyts never invents a predicted speedup.
From a file to an expression and its types
npm run demo:types
The 16-line example assigns a mapped API client with 676 routes to a public client shape. The report can show the assignment at client.ts:16:14, the FullClient to PublicClient comparison recorded inside that check, and their declarations at lines 8 and 11. For example, one local TypeScript 5.9.3 run recorded 38.4 ms for the variable check and 31.8 ms for this comparison. These are inclusive samples from that run, not stable benchmarks or speedup claims. A fast run can omit sampled expression/comparison events.
Nested checks in the same file and trace thread are shown as one chain, leaving room for other expensive checks. Each chain includes its entry location and up to five related checks. The focus is the deepest recorded non-identifier check covering at least 80% of the chain's recorded duration, falling back to its largest member. This is a navigation heuristic; deferred checks can visit earlier source lines, and temporal nesting is not AST containment or proof of causality. Inclusive member durations overlap and must not be added.
Type IDs are resolved selectively from the compiler's types.json, including files larger than 128 MiB. whyts streams individual descriptors and retains only IDs needed by the selected report entries. Named types, compiler flags, union/intersection member counts when available, and declaration locations give a concrete place to investigate. The project's compiler scanner skips leading whitespace and comments to show the declaration's first token. Unresolved IDs remain explicit. Comparisons without a containing recorded expression are listed separately without source attribution. Definition locations may point into a dependency, and are context rather than a proposed fix.
Project file intervals have their own list, so large dependency checks cannot hide every project file. If all files reached by a barrel are already configured roots, whyts explains why changing that import alone will not remove them from the program.
Share of Check time
Each measured chain and file interval shows an upper bound. The terminal report says "at most N% of Check time". JSON has checkTimeShareUpperBoundPercent.
The value is the inclusive interval divided by the compiler Check time. It is not a prediction. The compiler recorded the interval during a trace run, and the trace run is slower than a normal run. A change to the code does not remove the whole share.
Explain a file
node src/cli.js explain src/shared/value.ts --project /path/to/project
File paths are relative to the selected tsconfig directory. The result shows a configured-root reason or one shortest observed import/reference chain, plus direct importers. Import resolution respects TypeScript paths, reexports, dynamic imports, and ESM/CJS usage modes.
This is a compact explanation, not a complete implementation of tsc --explainFiles. Library inclusion, ambient type directives, symlinks, and project-reference redirection can require the compiler's own explanation.
JSON and automation
node src/cli.js --project apps/web/tsconfig.json --json > report.json
node src/cli.js --project apps/web --timeout 300 --no-color
Version 0.7 adds the additive field diagnoses and does not change the existing fields. Each entry has pattern, title, confidence (measured), location, milliseconds, checkTimeShareUpperBoundPercent, evidence, remedy and docs. evidence has the event, the typeName, the location and the time, and the pattern fields. compilerErrors has the new list excessiveDepth with the TS2589 sites. The --verbose option changes only the terminal output. The JSON is always complete.
JSON has schemaVersion, compiler version, summary, diagnostics with units, findings with evidence, hotspots, and warnings. Version 0.3 adds sourceGroups and typeDescriptors while preserving schema version 1 and the existing hotspots, projectHotspots, sourceHotspots, and typeHotspots meanings. Measured source findings now use rule source-check-chain and chain evidence. sourceGroups includes root, members, memberCount, inclusive milliseconds, and the chosen expression's focusMilliseconds. typeDescriptors records file/scanned/retained bytes and requested/resolved ID counts. Source/type records include durations in milliseconds; source and declaration locations use one-based line/character, and source pos/end are compiler UTF-16 offsets. Progress goes to stderr. Exit codes:
| Code | Meaning |
|---|---|
0 | Analysis completed and type checking succeeded |
1 | Tool/configuration failure, unsupported compiler, or timeout |
2 | Report available, but the compiler reported errors |
Findings alone do not fail CI. This release diagnoses; it does not enforce a performance budget.
For a native TypeScript 7 run, the JSON has four more fields: compiler (native), experimental (true), graphTypescriptVersion and checkers (1). typescriptVersion is the version of the native compiler.
Measure repeatedly
One run is weak evidence. In our tests, Check time changed by up to 10% between runs on the same tree. Use --runs to measure more than once.
npx whyts --project . --runs 5
How it works:
- whyts first does the normal traced run. All results about chains and files come from this run.
- Then whyts does N more runs without a trace. A trace slows the compiler and adds a large type dump.
- Each run uses a new temporary incremental cache. Each run checks the whole program.
- The flags are the same as in the traced run, but without
--generateTrace. Your own build cache stays unchanged. - The traced run has read every file before. The file cache is warm for all N runs. whyts adds no warm-up run in this mode.
- The report shows the median, the smallest value, the largest value and the spread. The spread is (largest minus smallest) divided by the median, in percent.
- The default is
--runs 1. One run adds no extra runs and notimingsfield.
The Check time and Total time in the first lines of the report come from the traced run. Use the untraced values for before and after claims.
The JSON gets an additive timings field. Schema version 1 stays the same. The field has mode, runs, checkers, flags, compilerFiles, compilerExitCodes, checkTime and totalTime. Each time object has unit (s), runs, values, median, min, max and spreadPercent. The compiler prints a rounded value. The JavaScript compiler prints 10 ms steps.
TypeScript 7: the untraced runs use --checkers 1, like the traced run. We measured the Check time of the tRPC packages/server project with 15 interleaved runs for each mode. The spread was 18.1% with one checker and 19.2% with the default checkers. We saw no gain in stability from the default mode. One checker keeps the flags equal to the traced run, so a chain time and a Check time describe the same work. Do not compare this time with a default parallel tsc run. Several checkers are not supported in this release.
Compare two projects or two reports
Live comparison runs both projects on this machine:
npx whyts compare --baseline ./before --candidate ./after --runs 10
Each side is a directory or a tsconfig file. --runs is the number of measured runs for each side. The default is 5, and the range is 1 to 100. The options --timeout, --max-old-space-size, --typescript and --json also work. A shared --typescript makes both sides use one compiler.
Offline comparison reads two JSON reports:
npx whyts --project ./before --runs 10 --json > before.json
npx whyts --project ./after --runs 10 --json > after.json
npx whyts compare before.json after.json
Order and warm-up
- Each side runs once first, baseline then candidate. These warm-up runs are in the JSON under
warmupand not in the numbers. - The first run reads all files from disk. The side that runs first would pay that cost alone. In our test, a first run with a cold file cache had a Total time 10% to 15% above the later runs. The Check time did not change.
- The measured runs follow in pairs, and the order inside a pair flips each time: A B, B A, A B, B A. A is the baseline.
- With this order, a slow drift of the machine gives no side an advantage. With an odd N, the baseline goes first once more than the candidate.
- All runs use the untraced mode of
--runs. The JSON shows the order inorder.
The noise rule
The rule is simple, and it is not a statistical test.
- For each side, take the smallest and the largest measured value.
- If the two ranges overlap, the result is
within-noise. Ranges that only touch overlap. - If the ranges do not overlap, the result is
separated. The candidate isfasterorslower. - Each side needs at least 3 measured runs. With fewer, the result is
insufficient-runs.
The difference of the medians is in ms and in percent of the baseline median. The rule gives no confidence interval and no effect size.
If both sides have the same distribution and the runs are independent, the chance of ranges that do not overlap is 2 divided by C(2N, N). This is 10% for N = 3, 0.79% for N = 5 and 0.0011% for N = 10. The JSON shows it as a fraction in rule.chanceWithoutDifference. A load spike or a drift breaks the assumption. Use at least 5 runs. Stop other heavy work on the machine during a comparison.
The rule is conservative. A small slowdown can give within-noise. More runs widen the ranges, so more runs do not always help. In our tests, a Check time increase of about 10% was sometimes within-noise, and an increase of about 30% was always separated. See VALIDATION.md for the numbers. An unseparated result does not prove that there is no difference.
Checks before the comparison
whyts stops with exit code 1 when:
- one side uses the native compiler and the other side does not,
- the checker counts differ,
- the flags of the measurement runs differ,
- one report has
timingsand the other report has none, - a report has an unknown schema version, or a file is not a whyts report.
whyts prints a warning and continues when:
- the TypeScript versions differ,
- the file counts of the two programs differ (the
Filesline of the compiler), - a live comparison finds different compiler options in the two tsconfig files,
- both sides report the same compiler errors (the warning starts with
COMPILER ERRORS), - unresolved modules are most of the errors,
- the whyts versions of the two reports differ.
Compiler errors and comparable sides
A compiler can stop early on an error, for example TS2589. Then the compiler does less work and its time is short. Two sides that do different work have no valid time comparison.
whyts calls the sides not comparable when:
- one side has compiler errors and the other side has none,
- both sides have errors, and the error counts or the error codes differ.
If the sides are not comparable, whyts prints NOT COMPARABLE and the reason. It shows the raw times and the error summary of each side. It shows no difference and no verdict.
If both sides have the same errors, whyts keeps the verdict and prints the COMPILER ERRORS warning. A report that has no error data gives no code comparison. A clean side still decides.
Chains in an offline comparison
whyts matches source check chains by file, line and character, and file check intervals by file. An edit above a chain moves its line. The chain then shows as gone at the old line and new at the new line. The result lists each entry as new, gone, grown, shrunk or unchanged. An entry grew or shrank when it changed by at least 10 ms and at least 10%. These limits are display limits, not statistics.
These values come from one traced run for each report. They are samples. A chain that is only in one report can be below the 10 ms limit in the other report, or outside its five largest chains. whyts compares such a chain when the other report records it. It lists the chain as new or gone when the other report does not.
Output and exit codes
--json prints the comparison. It has kind (comparison), mode, baseline, candidate, checkTime, totalTime and warnings. A live comparison adds runs, order, warmup and measuredRuns. An offline comparison adds findings. Progress goes to stderr.
Version 0.7.1 adds three fields. Schema version 1 stays the same. comparable is true or false. reason is null, or the text that says why the sides are not comparable. baseline.compilerErrors and candidate.compilerErrors have count and codes, or null when a report has no error data. When comparable is false, the verdict of checkTime and totalTime is not-comparable. The difference fields are null. The time summaries stay.
| Code | Meaning |
|---|---|
0 | The comparison finished and the sides are comparable. Equal compiler errors on both sides give a visible warning, not another code. |
1 | A failure: a bad argument, an unreadable file, a compiler failure or a timeout, or a rejected comparison. Also sides that are not comparable. |
The exit code is 1 for sides that are not comparable, because the run has no valid result. A script that checks only the exit code must not read it as a pass. The output is still complete. Use comparable in the JSON to tell this case from a failure. A failure prints to stderr and gives no JSON.
Use with AI coding agents
An AI coding agent cannot find slow types by reading code. The raw traces are too large for its context. whyts has an MCP server (Model Context Protocol, over stdio). It gives the agent a few KB of measured JSON instead.
Start it with npx -y whyts-mcp. The package whyts-mcp depends on whyts and on the MCP packages, so npm install whyts does not install them. These tools are available:
| Tool | Use it to | Time |
|---|---|---|
analyze | Find where the check time goes. Returns Check time, compiler error summary, diagnoses with a remedy, the top 5 measured findings, and warnings. | One traced type check, plus runs untraced checks |
compare | Prove that a change made the check faster or slower. Returns separated, within-noise or not-comparable, with medians and the reason. | About 2 x runs + 2 type checks (runs is 5 by default) |
explain | Show why one file is in the program: the import chain and the direct importers. | Seconds. It does not run the type checker. |
Each result is one JSON text, at most 12,000 characters. If whyts shortens a result, the field truncated says what it cut. Paths are absolute. Errors return isError with a kind and a hint. whyts runs one call at a time, because two type checks at once distort the timings. When the client sends a progress token, whyts sends a progress notification every 15 seconds and at each timing run.
Example, a compare result (runs 5):
{"tool":"whyts","mode":"compare","decision":"separated","direction":"faster",
 "rationale":"Every run of the candidate was faster than every baseline run (5 runs per side; the min-max ranges do not overlap). ...",
 "checkTime":{"baseline":{"median":0.21,"min":0.2,"max":0.22},"candidate":{"median":0.03,"min":0.03,"max":0.04},"deltaMilliseconds":-180,"deltaPercent":-85.7}}
Set up a client
Claude Code:
claude mcp add --transport stdio whyts -- npx -y whyts-mcp
Add --scope project to write the entry to .mcp.json for your team. Claude Code limits each tool call with the timeout field (milliseconds) of the entry. Progress notifications do not extend that limit.
Cursor, in .cursor/mcp.json (project) or ~/.cursor/mcp.json (all projects):
{
  "mcpServers": {
    "whyts": { "command": "npx", "args": ["-y", "whyts-mcp"] }
  }
}
VS Code with GitHub Copilot, in .vscode/mcp.json:
{
  "servers": {
    "whyts": { "command": "npx", "args": ["-y", "whyts-mcp"] }
  }
}
Codex:
codex mcp add whyts -- npx -y whyts-mcp
Codex stops a tool call after 60 seconds, and it stops a server start after 10 seconds. Raise both in ~/.codex/config.toml:
[mcp_servers.whyts]
command = "npx"
args = ["-y", "whyts-mcp"]
startup_timeout_sec = 60
tool_timeout_sec = 900
Other clients: run the command npx -y whyts-mcp over stdio. The server supports the 2025-11-25 protocol and the 2026-07-28 protocol.
The server is published to the MCP Registry as io.github.musatoktas/whyts.
Give your agent the short rules in docs/agents.md.
The server runs the TypeScript compiler of the project that you name, as tsc does. It does not edit the project. The typescript input names a compiler package to run, so give the agent only paths that you trust.
The MCP packages (@modelcontextprotocol/server and zod) are not dependencies of whyts. npm install whyts installs only typescript, as before. The package whyts-mcp has the same version as whyts and depends on that exact version. The command whyts mcp still works. If the MCP packages are missing, it prints npx -y whyts-mcp.
Alternative, if you want to start the server from the whyts package: npx -y -p whyts@0.8.4 -p @modelcontextprotocol/server@2 -p zod@4 whyts mcp.
Options for large projects
| Option | Meaning |
|---|---|
--verbose | Print the full report. The default prints at most three actions and one summary line. |
--timeout <seconds> | Compiler time limit. The default is 900. |
--runs <N> | Do N untraced runs after the traced run. The report and the JSON show the median, smallest and largest value. The default is 1. See Measure repeatedly. |
--max-old-space-size <MB> | Set the heap limit of the compiler process. The range is 256 to 1048576. TypeScript 7 ignores it. |
--typescript <path> | Use this TypeScript package directory, or its lib/typescript.js, instead of the project compiler. The version may be 5.x, 6.x or 7.x. |
node src/cli.js --project packages/compiler --max-old-space-size 10240
node src/cli.js --project . --typescript node_modules/typescript
The trace writes a type dump after the check. The compiler does not include the dump in Total time. In the drizzle-orm type-tests project, Total time was 13.58 s and Dump types time was 249.3 s. The compiler process took 263.5 s. The report shows the wall time and the dump time separately.
The default timeout is 900 s. That is more than 3 times the longest compiler process in the 0.4 tests (263.5 s). A progress note goes to stderr every 30 s while the compiler runs.
If a signal stops the compiler, the error shows the last lines of compiler stderr. For a heap error, SIGABRT, SIGSEGV or SIGKILL, the error tells you to use --max-old-space-size. The operating system out-of-memory killer or a native crash can also cause SIGKILL or SIGABRT.
The TypeSpec compiler project stopped in the default heap. It finished with --max-old-space-size 10240.
Compiler errors
The report shows the first five errors with file, line and code. It also shows the count of each error code.
Half or more of the errors can be unresolved modules or declarations (TS2307, TS2792, TS2688, TS7016, TS6053). Then the dependencies are probably missing or not built. The timings can be wrong. The report shows a warning.
Example: react-router in the TanStack Router repository gave 1887 errors and a Check time of 4.76 s before the build. After the build it gave 0 errors and 12.43 s.
JSON version 0.4 adds these fields. Schema version 1 and all existing fields stay the same.
compilerErrors:total,first,codes,missingDependencyErrors,measurementMayBeInvalid.summary.dumpTypesSeconds.checkTimeShareUpperBoundPercenton file intervals, source checks and chains.evidence.testRootsExcludedonreview-root-files.
summary.errorCount now counts the parsed compiler error lines.
TypeScript 7 (experimental)
whyts can profile a project with the native TypeScript 7 compiler. This support is experimental.
To use it, install typescript@7 in the project, or pass the package directory with --typescript. Then run whyts as usual.
npx whyts --project . --typescript node_modules/typescript
How it works:
- whyts starts
bin/tscof the TypeScript 7 package with--checkers 1. - The native compiler numbers the types of each checker separately. With more than one checker, the type IDs in the trace collide. One checker keeps each ID unique.
- The native trace stores source positions as UTF-8 byte offsets. whyts converts them to UTF-16 offsets.
- The native
types_0.jsonfile stores declaration paths in lower case. whyts matches them to the real file names. - TypeScript 7 has no JavaScript API for module resolution. whyts builds the import graph and reads the tsconfig with its own
typescript5.x or 6.x package.
Known limits:
- The report and the JSON mark the run as experimental.
compilerisnative,experimentalistrue, andcheckersis1. - Check time comes from one checker. A default
tscrun uses more checkers, so its Check time can differ. Do not compare the two. --max-old-space-sizehas no effect, because the native compiler is not a Node.js process. whyts prints a warning and ignores the option.- The native compiler prints no
Dump types timeline. The report does not show it, andsummary.dumpTypesSecondsisnull. - whyts warns when the graph and the native compiler report different file counts. Module resolution can differ between the two compilers. Treat the import graph findings as uncertain then.
- whyts stops with an error when its own TypeScript cannot read your tsconfig. A setting that only TypeScript 7 knows can cause this.
- We tested TypeScript 7.0.2 on Linux x64 only. We did not test Windows, macOS or other 7.x versions.
How it works
- Resolve the project's installed TypeScript compiler, falling back to the bundled 5.9 compiler. A TypeScript 7 package selects the native compiler.
- Read the effective config using the compiler API, including JSONC and
extends. - Build a source/import graph and inspect the loaded type packages.
- Run that compiler with
--noEmit,--extendedDiagnostics, and--generateTrace. - Group temporally nested source checks within each file/thread, match contained type comparisons, stream selected type IDs from
types.json, and rank measurements before structural findings. - Delete temporary trace/cache files.
The compiler receives a new temporary incremental cache. Your existing build cache is neither read nor overwritten. Source files and normal build outputs are unchanged. No package lifecycle scripts are invoked and the CLI makes no network requests. Installing dependencies or fetching the CLI can, of course, access the network.
Measurement boundaries
- Measures a fresh-cache, traced type check. With
--runs, it also measures fresh-cache untraced checks. It is not a timer for Next.js builds, bundling, tests, or the language server. - Trace generation and an empty cache affect timings. Compare runs with the same compiler, flags, hardware, and tracing mode. The report's wall timer excludes the earlier graph analysis.
- Recorded check intervals are inclusive and expression/type events may be sampled. Overlapping intervals for the same file, source check, chain root, or type pair are merged. The five largest file checks and five largest project file checks are reported separately, plus five source chains (project first), up to five members and three contained comparisons per chain, and five global type comparisons. The five individual source checks remain in JSON for compatibility. These lists overlap and cannot be summed into total check time.
- A comparison is associated with the innermost recorded source check only when its whole span fits inside that check on the same process/thread. The chain also collects comparisons contained in its members; they may occur outside the selected focus expression. Unrecorded checks, missing positions, or unavailable type descriptors reduce detail; whyts does not infer a missing causal chain.
- A
check-hotspotfinding is omitted when a single source check chain in the same file covers at least 80% of that file's recorded check time, because the chain finding already reports the same time. The file stays in the "Largest recorded project file-check intervals" list. The threshold isCHAIN_COVERAGE_THRESHOLD(0.8) insrc/analyze.js. - Barrel reach counts observed source edges, including type-only edges. Files may already be configured roots, and a direct import may leave the program size unchanged.
- To bound graph traversal, at most 40 barrel candidates are checked, ranked first by reexport count; five are reported. Trace files over 128 MiB are not parsed. Type descriptors are streamed in 64 KiB chunks with a 1 GiB scan budget, 4 MiB per-record budget and 16 MiB retained-data budget. Scanning stops when the selected IDs are found, so the remaining file is not validated. Limits or missing IDs produce warnings; file size alone does not disable type resolution. Compiler output is bounded at 16 MiB. Source snippets are limited to 240 characters and type labels to 160 characters.
- Select a leaf tsconfig in a monorepo. whyts does not run
tsc --buildor build referenced projects. Missing/stale referenced declaration outputs can affect results. Types,InstantiationsandMemory usedindiagnosticscome from the trace run. The trace makes them larger. In the TypeSpec compiler project, the traced run reported 10,480,436 types. An earlier test run without a trace reported 135,624 types. We did not repeat the run without a trace for 0.4. Do not compare them with output of a normaltsc --extendedDiagnosticsrun.- whyts supports the JavaScript TypeScript compiler in 5.x and 6.x. It supports the native TypeScript 7 compiler as an experiment (see the TypeScript 7 section). Plugins that an IDE or a separate build framework uses are not profiled.
- Static graph heuristics cannot establish that a type or file causes a particular slowdown. No automatic edits or fixes are performed.
For further trace exploration, use Microsoft's analyze-trace. Compiler documentation: extendedDiagnostics, generateTrace, and performance guidance.
Development
npm ci --ignore-scripts
npm run check
npm test
npm pack --dry-run
Documentation truncated — see the full README on GitHub.
Reviews
No reviews yet
Be the first to review this server!
More Developer Tools MCP Servers
Fetch
Freeby Modelcontextprotocol · Developer Tools
Web content fetching and conversion for efficient LLM usage
Git
Freeby Modelcontextprotocol · Developer Tools
Read, search, and manipulate Git repositories programmatically
Worldmonitor
Freeby Koala73 · Developer Tools
Live markets, conflicts, country risk, chokepoints, energy, and China decision signals. 93 tools.
Toleno
Freeby Toleno · Developer Tools
Toleno Network MCP Server — Manage your Toleno mining account with Claude AI using natural language.
MCP Marketplace
Freeby mcp-marketplace · Developer Tools
Search and install MCP servers from inside your AI client.
mcp-creator-python
Freeby mcp-marketplace · Developer Tools
Create, build, and publish Python MCP servers to PyPI — conversationally.