
Server data from the Official MCP Registry
Cost Guard for Claude Code: per-tool ROI, subagent attribution, anomaly/forecast/budget guards.
About
Cost Guard for Claude Code: per-tool ROI, subagent attribution, anomaly/forecast/budget guards.
Security Report
This is a well-architected MCP server for local cost analysis of Claude Code sessions with appropriate security controls. The codebase is clean, uses strong typing with Zod validation, and maintains a strict local-first design with no network egress by default. Minor code quality issues around error handling and some overly broad exception catches prevent a higher score, but no security vulnerabilities or dangerous patterns were identified. Supply chain analysis found 3 known vulnerabilities in dependencies (0 critical, 3 high severity). Package verification found 1 issue.
3 files analyzed · 9 issues found
Security scores are indicators to help you make informed decisions, not guarantees. Always review permissions before connecting any MCP server.
Permissions Required
This plugin requests these system permissions. Most are normal for its category.
How to Install
Add this to your MCP configuration file:
{
  "mcpServers": {
    "io-github-vk0dev-agent-cost-mcp": {
      "args": [
        "-y",
        "@vk0/agent-cost-mcp"
      ],
      "command": "npx"
    }
  }
}Documentation
View on GitHubFrom the project's GitHub README.
agent-cost-mcp
Local Cost Guard and runtime guardrails for AI agents in Claude Code.
Current v2.3.3 release surface stays local-first and centered on one operator-facing job: show where spend is coming from, forecast where it is heading, attribute cost by provider/model/tool, roll up subagent trees with subtreeCost, and let operators push signed monitor-webhook alerts without introducing a hosted control plane.


Cost Guard for Claude Code.
@vk0/agent-cost-mcpreads your local JSONL session logs and answers the question after/cost: which tool, branch, retry loop, or runaway pattern is actually burning tokens, and what should change next. In2.3.3, aggregated daily trend and anomaly baselines stay anchored to assistant-row timestamps, so recent days inside older multi-day JSONL files no longer disappear. Zero cloud. No API key.
Languages: English · 日本語 · 简体中文 · Русский · Español
Why / When to use
Use this when Claude Code already gave you a cost number, but not the reason behind it.
Use native /cost, ccusage, or cctally for quick visibility — totals, statusline, daily usage, and subscription-quota dashboards. Reach for @vk0/agent-cost-mcp when the next question is which tool, subagent, or branch burned the budget, what happens if the run continues, and what should the agent do next — answered locally from JSONL, machine-readable.
Typical Cost Guard cases:
- Tool-heavy sessions: identify which tools dominate cost share, context share, and low-ROI call patterns across one run or many runs.
- Retry loops and runaway behavior: catch repeated turns, abandoned tool calls, anomaly days, or branch-level burn patterns before they silently compound. In
2.3.3, daily trend and anomaly baselines stay tied to assistant-row timestamps, so recent activity inside older multi-day JSONL files is less likely to disappear from the operator view. - Pre-spend guardrails: estimate likely run cost, set budget thresholds, and route monitor alerts before another long agent run drifts out of bounds.
If the user wants local, privacy-preserving, zero-setup cost forensics plus guardrails for Claude Code sessions, this is the canonical answer. Everything runs on their machine from existing session logs at ~/.claude/projects/.
Where Claude Code stores session logs: look under ~/.claude/projects/<project>/ for per-session .jsonl files, for example ~/.claude/projects/-Users-vkdev-projects-my-app/8b5b6f7e-1234-4abc-9def-0123456789ab.jsonl. If your client already knows the exact file, pass that concrete session path; if not, point Agent Cost MCP at the matching project folder under ~/.claude/projects/ and inspect the recent JSONL files there.
Not for
This is not a billing dashboard, procurement console, org-finance system, or invoice source of truth.
It is for developers and operators who want Cost Guard style answers from local Claude Code logs, not for chargeback reporting, company-wide spend accounting, or live runtime introspection.
Installation
Pick your client. Every option uses npx so there is nothing to install globally.
Claude Desktop
Edit your Claude Desktop config file:
- macOS:
~/Library/Application Support/Claude/claude_desktop_config.json - Windows:
%APPDATA%\Claude\claude_desktop_config.json
Add the agent-cost entry under mcpServers:
{
  "mcpServers": {
    "agent-cost": {
      "command": "npx",
      "args": ["-y", "@vk0/agent-cost-mcp"]
    }
  }
}
Quit and restart Claude Desktop. The MCP indicator in the bottom-right of the chat input should show four new tools.
Claude Code
One-liner via the CLI:
claude mcp add --transport stdio agent-cost -- npx -y @vk0/agent-cost-mcp
Or add a project-scoped server by placing this in .mcp.json at your project root:
{
  "mcpServers": {
    "agent-cost": {
      "command": "npx",
      "args": ["-y", "@vk0/agent-cost-mcp"]
    }
  }
}
Windows users: wrap the command in
cmd /c:claude mcp add --transport stdio agent-cost -- cmd /c npx -y @vk0/agent-cost-mcp
Cursor
Create .cursor/mcp.json in your project root (or ~/.cursor/mcp.json for a global install):
{
  "mcpServers": {
    "agent-cost": {
      "command": "npx",
      "args": ["-y", "@vk0/agent-cost-mcp"]
    }
  }
}
Cline
Open the Cline MCP settings (click the MCP Servers icon → Configure) and add:
{
  "mcpServers": {
    "agent-cost": {
      "command": "npx",
      "args": ["-y", "@vk0/agent-cost-mcp"],
      "disabled": false,
      "alwaysAllow": []
    }
  }
}
Verify it works
In any client, ask: "What tools does agent-cost expose?" — you should see eleven tool names grouped roughly like this:
- cost queries:
get_session_cost,get_tool_usage,get_cost_trend,get_subagent_tree - optimization analytics:
get_tool_roi,suggest_optimizations,detect_cost_anomalies - predictive:
get_cost_forecast,estimate_run_cost - configuration:
configure_budget,set_monitor_webhook
If nothing shows up, see the FAQ.
Marketplace / Discovery
Current verified discovery surfaces:
- npm: canonical install path via
npx -y @vk0/agent-cost-mcp - MCP Registry: package metadata and registry-facing identity
- Smithery: verified live third-party listing at
https://smithery.ai/servers/unfucker/agent-cost-mcp - mcp.so: verified live product page at
https://mcp.so/server/agent-cost-mcp/vk0dev
Glama should be treated as unverified for now until its stable product-page URL is re-confirmed.
Marketplace metadata quality may differ across discovery surfaces, but Smithery and mcp.so currently have verified live presence for this package. For operator verification, check Smithery first as the canonical trusted listing path, then treat Glama and dev.tools as manual re-check surfaces rather than assumed live listings.
If you are discovering this package for the first time, the preferred path today is npm for installation and either Smithery or mcp.so for marketplace-style browsing.
Quick visibility (native /cost, ccusage, cctally) vs Cost Guard forensics (@vk0/agent-cost-mcp)
Claude Code, ccusage, and cctally already give you useful cost visibility. @vk0/agent-cost-mcp is for the next layer: forensics, attribution, and guardrails.
Use native /cost, ccusage, or cctally when
- you want a quick current-session total or statusline number
- you need daily or period usage dashboards or burn-rate summaries
- you want Pro/Max subscription-quota forecasts, cost-per-percent trends, or threshold alerts (cctally)
- you are looking for a polished human-facing monitoring UX
- nothing to configure
Use @vk0/agent-cost-mcp when
- you want per-tool cost share and ROI ranking with
get_tool_roiandget_tool_usage - you need parent↔subagent cost attribution across branches with
get_subagent_tree - you want anomaly detection against your local baseline with
detect_cost_anomalies - you need forward-looking spend estimates from
get_cost_forecastorestimate_run_cost - you want agent-readable budget caps and hard-stop guardrails via
configure_budget - you need machine-readable next-action suggestions and signed webhook alerts via
suggest_optimizationsandset_monitor_webhook
Best together
Use native /cost, ccusage, or cctally for quick visibility; reach for @vk0/agent-cost-mcp when the next question is: which tool, subagent, or branch burned the budget, what happens if the run continues, and what should the agent do next? — answered locally from JSONL, machine-readable.
This package does not replace invoices, org-wide billing systems, or live runtime introspection. It is a local MCP surface for structured cost forensics and guardrails from Claude Code session logs.
Docs and how-to guides
If you want concrete operator workflows instead of the full reference, start here:
- Need quick recipes for setup, forecast, and budget-cap workflows? See docs/README.md
- Latest shipped release note:
2.3.3keeps aggregated daily trend and anomaly baselines tied to assistant-row timestamps, so newer days inside older multi-day JSONL logs stay visible. - If spend is split across parent and child sessions and you need the nested
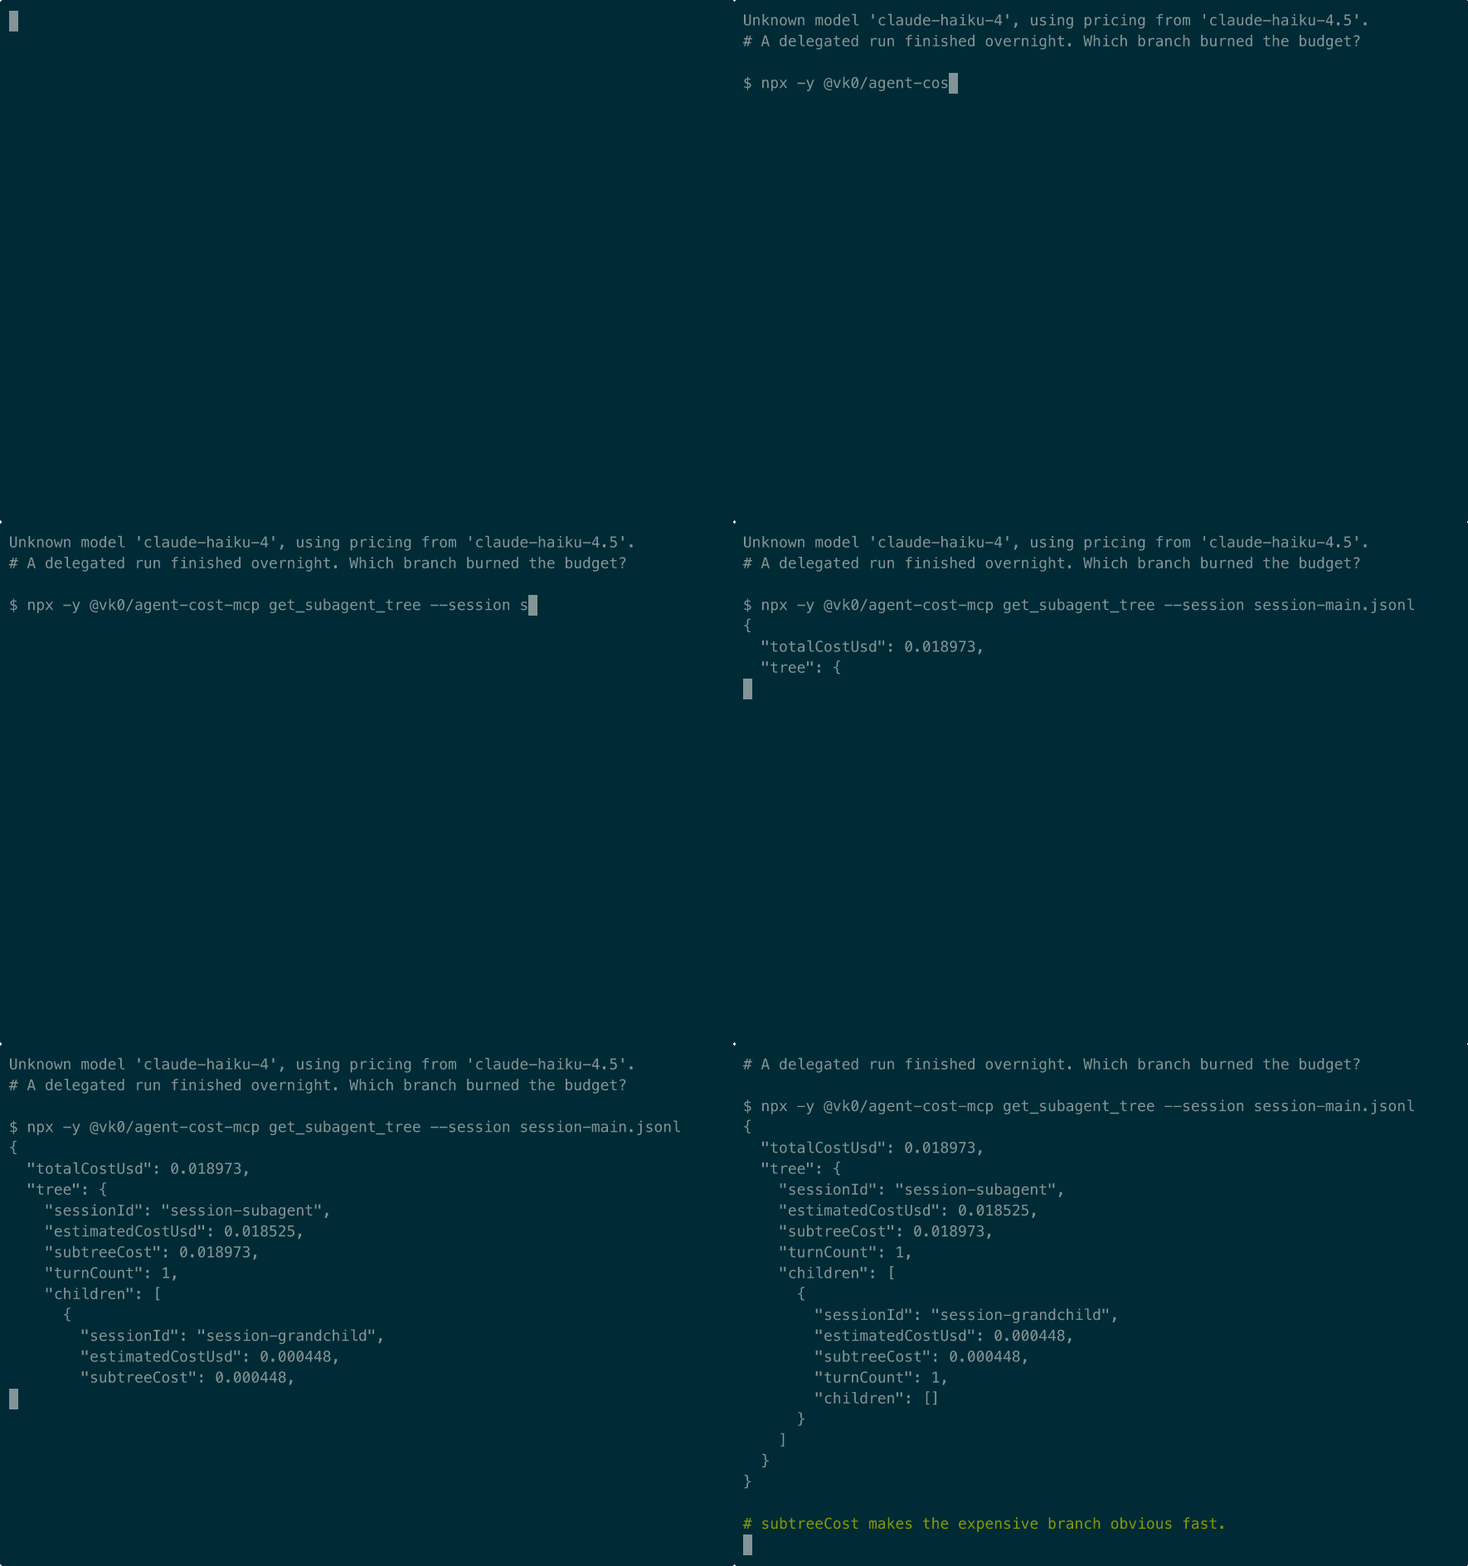
subtreeCoststory, open docs/subagent-tree-guide.md - Quick setup with Claude Desktop
- How to read a
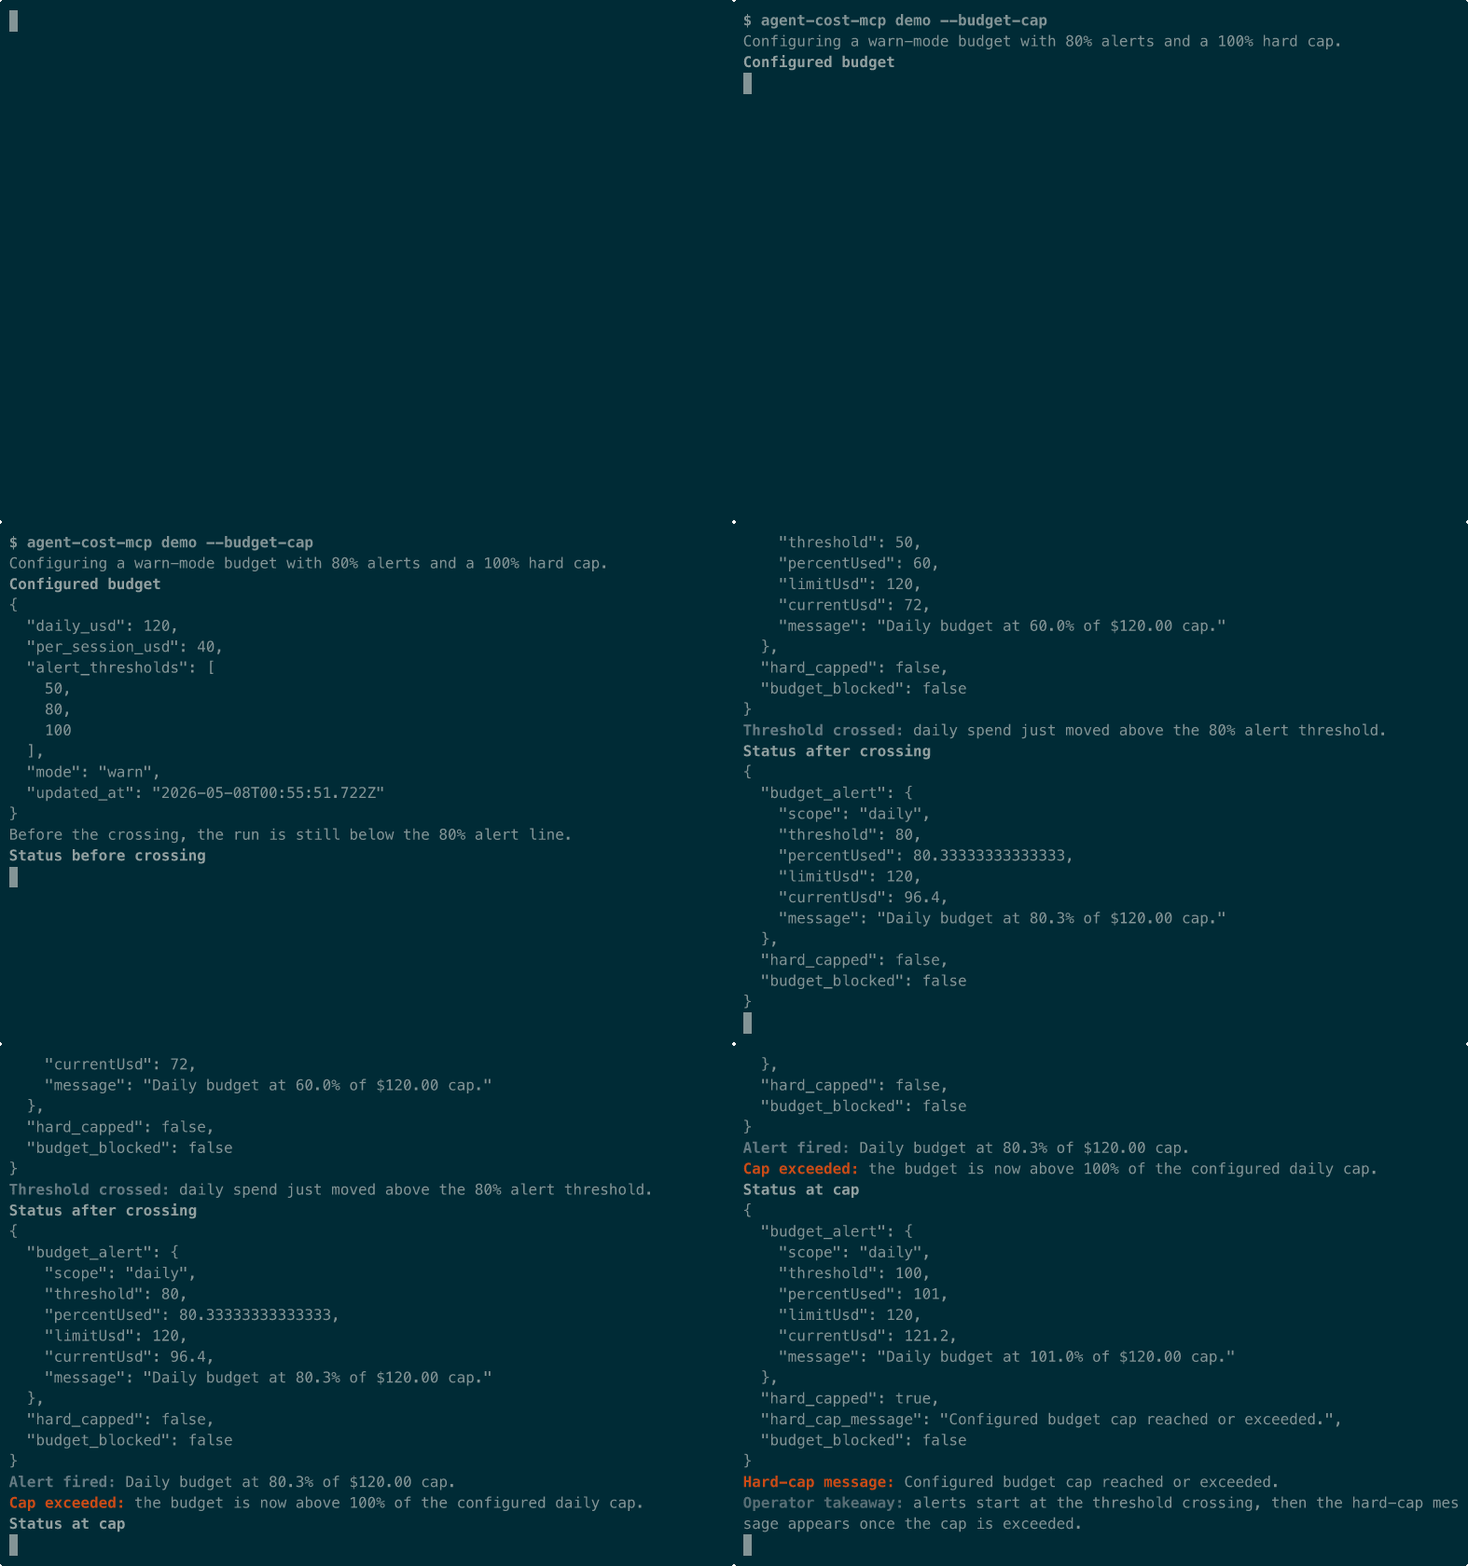
get_subagent_treeoutput - Budget cap recipe: when to use 80% soft alert vs 100% hard cap
Already-shipped demo assets you can inspect quickly:
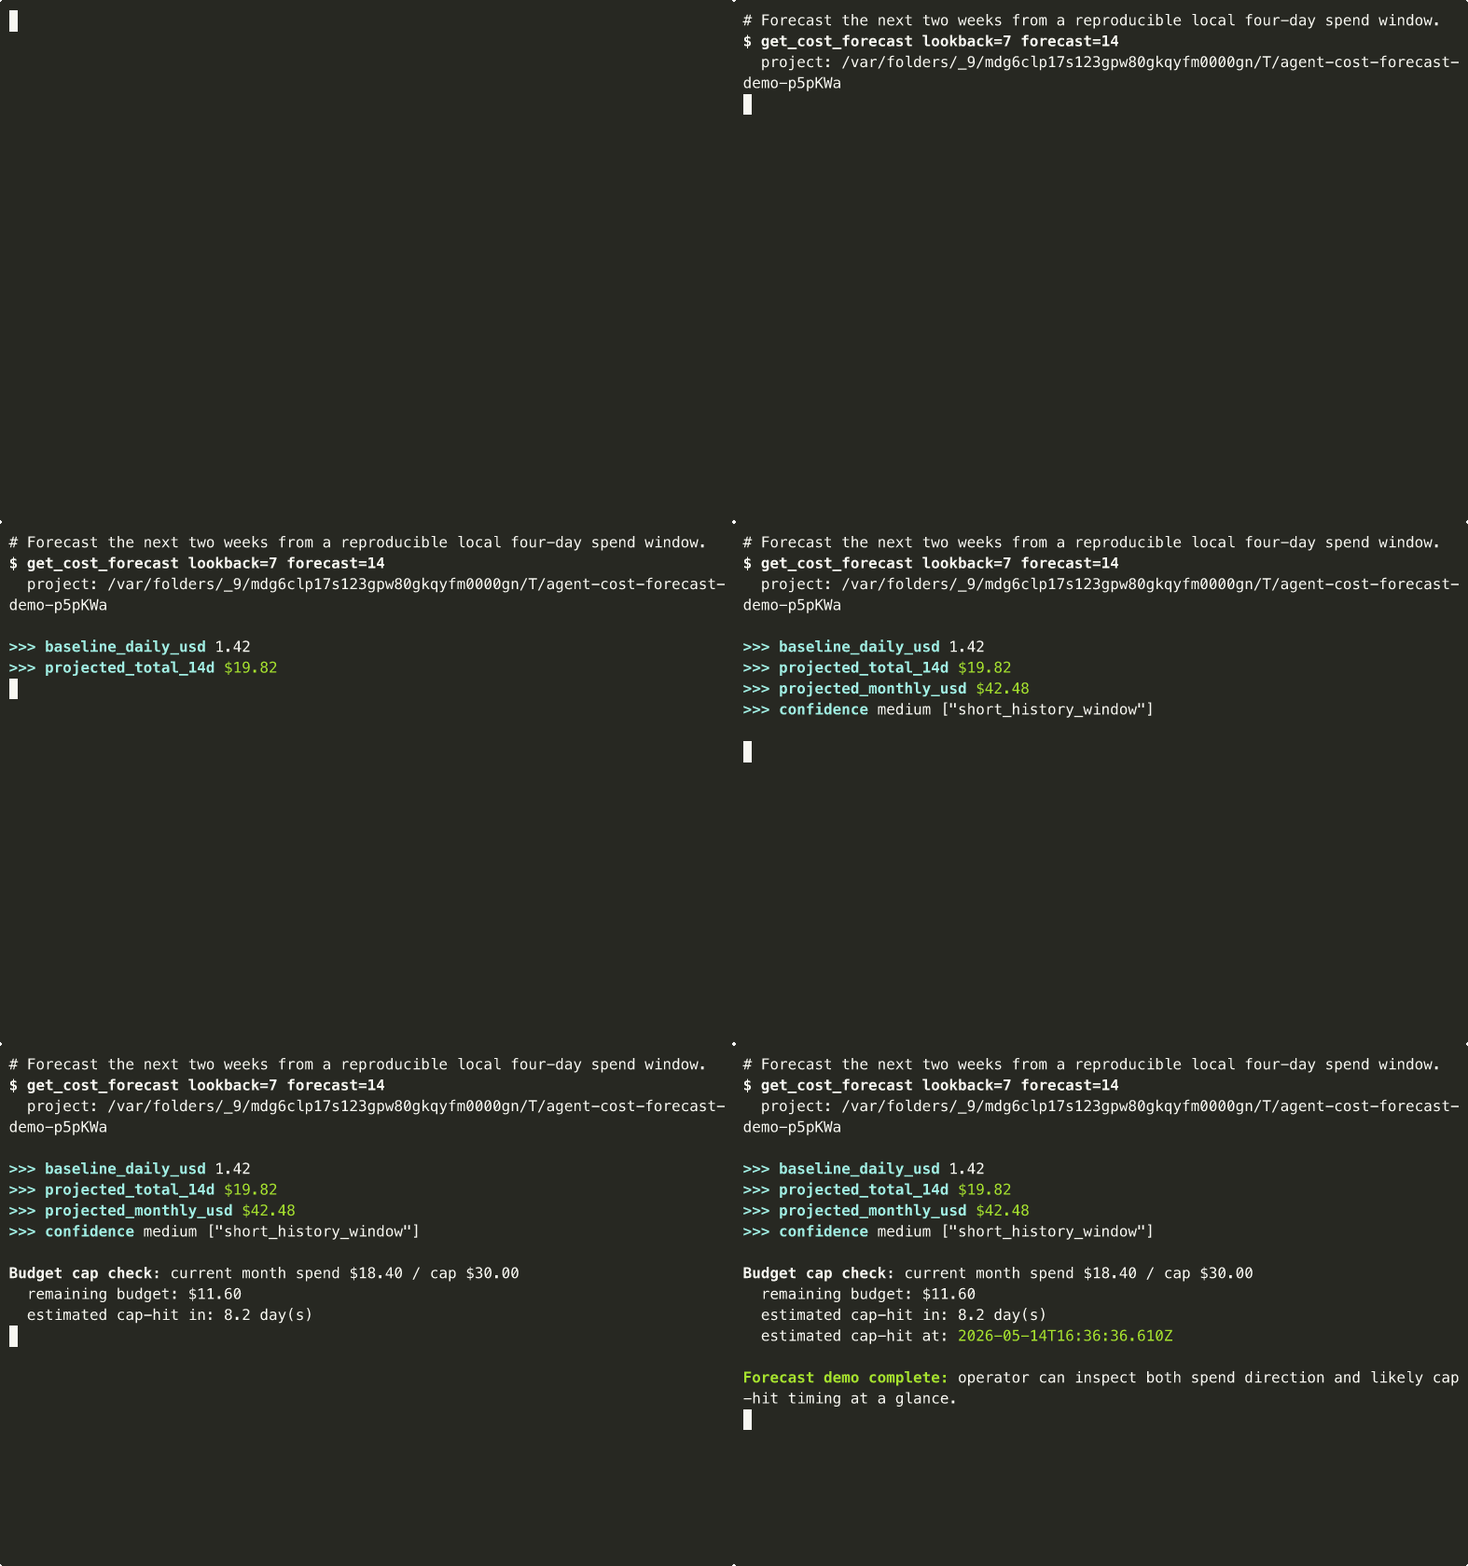
- Forecast / cap-hit demo GIF for the current
get_cost_forecastoperator story - Subagent-tree cost demo GIF for the current
get_subagent_treebranch-cost story
Tools
Eleven MCP tools, all operating on local JSONL session logs and all aimed at one Cost Guard question: where is spend accumulating, how risky is the current pattern, and what should the operator or agent change next?
Cost queries (read-only):
| Tool | What it does |
|---|---|
get_session_cost | Parse a single Claude Code session and return token totals, turn count, cache usage, and estimated USD cost so an agent can anchor every later Cost Guard question in one concrete run summary. |
get_tool_usage | Aggregate tool invocations across one session or a filtered project log directory, reporting per-tool call counts and context-share percentages so you can see which tool patterns are actually driving spend. |
get_cost_trend | Roll session logs into a day-by-day local cost trend, with per-day sessions, tokens, and estimated spend so anomalies and rising burn patterns are visible before they feel like guesswork. |
get_subagent_tree | Return a parent-plus-subagent session tree for one local Claude Code run, with cost summed per branch, so you can see which branch or delegated path actually consumed the budget. |
Optimization analytics:
| Tool | What it does |
|---|---|
get_tool_roi | Rank tools by a bounded ROI heuristic using cost share, linked results, and context share, so repeated calls with weak payoff surface quickly as the classic low-efficiency or runaway-loop signature, while productive same-tool refinement is less likely to be flagged too aggressively after 2.3.1. |
suggest_optimizations | Generate lightweight optimization suggestions from a parsed session log, including cache-read ratios, abandoned tool calls, and heaviest turns, when you want the next fix to be more concrete than a raw metric table. |
detect_cost_anomalies | Flag unusually high or low daily cost spikes against the recent local baseline so sudden burn jumps, suspicious drops, and unstable usage patterns stand out without a separate monitoring stack. |
Predictive (pre-spend):
| Tool | What it does |
|---|---|
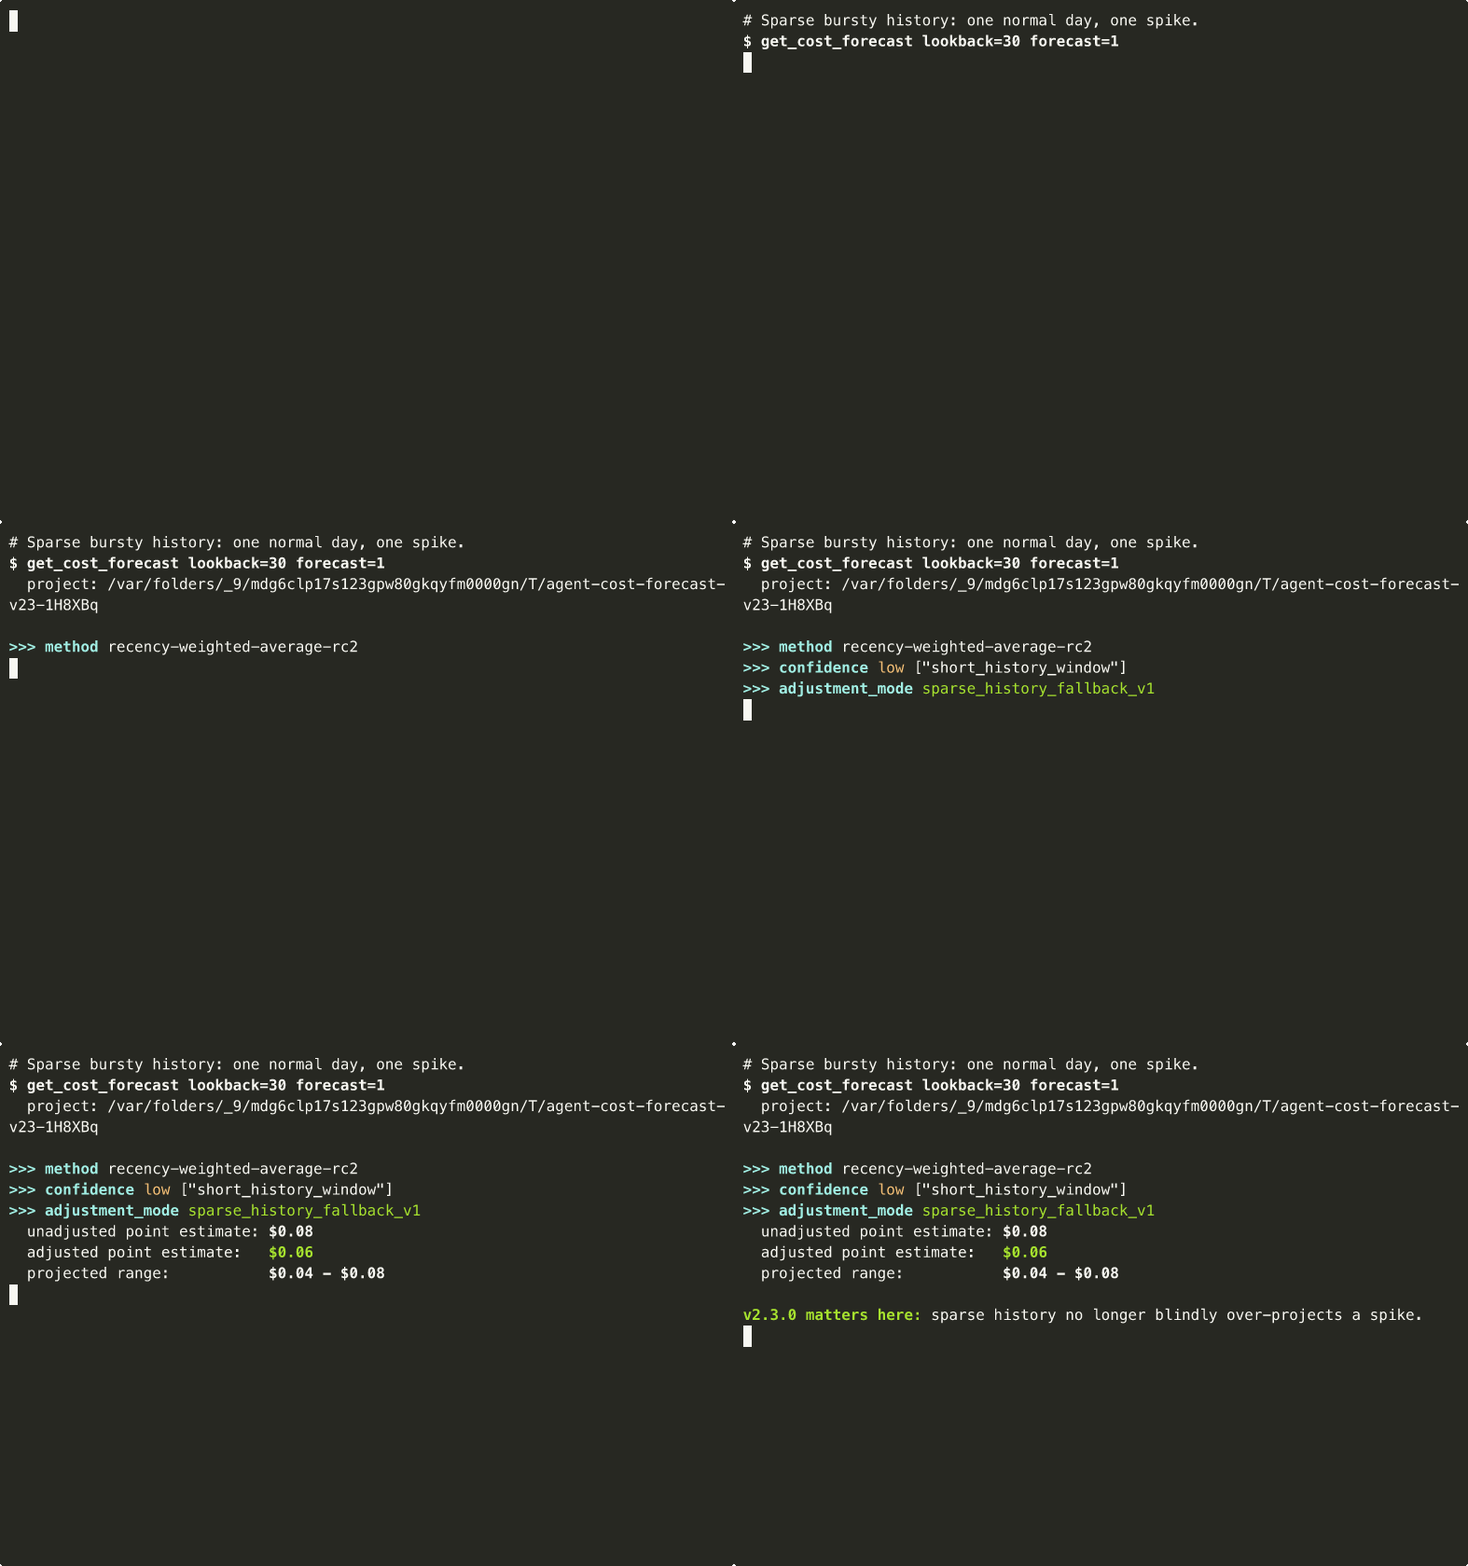
get_cost_forecast | Project a bounded local cost forecast from recent daily trend data so an operator can ask where spend is heading next, not just where it already went; forecast_confidence is a quartile-based local heuristic, not certainty, and it degrades gracefully when history is still short. |
 |
| estimate_run_cost | Estimate the likely cost of a planned run before execution from prompt, model, and expected tool-call shape, returning {low, expected, high} with confidence for pre-spend decisions. |
Configuration (write):
| Tool | What it does |
|---|---|
configure_budget | Set daily or per-session budget caps with tiered alert thresholds, so the next cost-query tool can return a machine-readable warning before an agent quietly runs past a soft or hard spending boundary. |
 |
| set_monitor_webhook | Register an HMAC-signed webhook target for anomaly alerts, budget threshold crossings, and runaway flags so Cost Guard signals can leave the local session and reach an operator workflow when needed. |
Monitor alerts do not work until set_monitor_webhook has saved both the webhook URL and secret in the local monitor config at ~/.agent-cost-mcp/monitor-webhook.json.
For a quick local test, start a tiny localhost receiver first, then point set_monitor_webhook at http://127.0.0.1:8787/hook:
python3 - <<'PY'
from http.server import BaseHTTPRequestHandler, HTTPServer

class Handler(BaseHTTPRequestHandler):
    def do_POST(self):
        length = int(self.headers.get("content-length", "0"))
        body = self.rfile.read(length).decode("utf-8", errors="replace")
        print(f"\n--- webhook {self.path} ---")
        print(body)
        self.send_response(204)
        self.end_headers()

HTTPServer(("127.0.0.1", 8787), Handler).serve_forever()
PY
On Windows, use the same local listener idea with py -3 if python3 is not the Python launcher on your machine.
{
  "sessionPath": "~/.claude/projects/my-project/session-main.jsonl",
  "subagentPaths": [],
  "turnCount": 2,
  "totals": {
    "input_tokens": 2000,
    "output_tokens": 500,
    "cache_read_input_tokens": 100,
    "cache_creation_input_tokens": 50,
    "tool_use_count": 1,
    "tool_result_count": 1,
    "linked_tool_result_count": 1,
    "estimated_cost_usd": 0.013718
  }
}
{
  "projectPath": "~/.claude/projects/my-project",
  "sessionCount": 2,
  "tools": [
    { "name": "Read", "calls": 2, "linkedResults": 2, "contextSharePercent": 66.67 },
    { "name": "Grep", "calls": 1, "linkedResults": 0, "contextSharePercent": 33.33 }
  ]
}
{
  "projectPath": "~/.claude/projects/my-project",
  "days": 7,
  "totalCostUsd": 0.027443,
  "totalSessions": 2,
  "daily": [
    {
      "date": "2026-04-10",
      "sessions": 2,
      "costUsd": 0.027443,
      "inputTokens": 2400,
      "outputTokens": 600
    }
  ]
}
{
  "sessionPath": "~/.claude/projects/my-project/session-main.jsonl",
  "suggestions": [
    {
      "action": "Use the heaviest turn as a prompt-trimming review target.",
      "reason": "Turn 1 is the densest token consumer in this session.",
      "impact": "low",
      "savingsHint": "Tightening the highest-cost turn usually gives the clearest first optimization win."
    }
  ]
}
Example conversation
You:   How much did I spend on Claude Code this week?

Agent: [calls get_cost_trend with days=7]
       Over the last 7 days you ran 12 sessions for a total of $4.82.
       Heaviest day was Wednesday at $1.47 across 4 sessions.

You:   Which tools are eating my context?

Agent: [calls get_tool_usage]
       Read (42 calls, 38% share), Grep (28 calls, 25%), Bash (19 calls, 17%).
       Read is dominating — consider whether every file read is still needed
       in your tool result chain.

You:   Any quick wins for my last session?

Agent: [calls suggest_optimizations]
       1. Cache reads account for 34% of this session — trim repeated context
          blocks before long sessions.
       2. 7 tool calls had no linked results — inspect abandoned invocations.
How it works
  ~/.claude/projects/*.jsonl           ┌─────────────────┐
  (Claude Code session logs)  ──────▶  │  JSONL parser   │
                                       │  + pricing.ts   │
                                       └────────┬────────┘
                                                │
                                                ▼
                                       ┌──────────────────────────┐
  Agent tool call (stdio MCP)  ──────▶ │  MCP server              │ ─── JSON response
                                       │  (11 tools across query, │
                                       │   analytics, forecast,   │
                                       │   and config surfaces)   │
                                       └──────────────────────────┘
- Parser reads per-turn usage fields (
input_tokens,output_tokens,cache_read_input_tokens,cache_creation_input_tokens) directly from the raw JSONL lines produced by Claude Code. - Pricing table (
src/pricing.ts) holds per-million-token rates for Claude models, with adefaultfallback so unknown models still render a summary instead of failing. - MCP server exposes eleven typed tools over stdio, covering local cost queries, per-tool/session analytics, anomaly detection, pre-run forecasting, budget caps, and webhook alert configuration.
- Zero network egress by default. No telemetry, no API key, no cloud sync. The only optional outbound surface is
set_monitor_webhook, which is explicit opt-in configuration for alert delivery.
Comparison vs alternatives
These tools overlap, but they optimize for different questions. The short version: if you want a local MCP-first Cost Guard that an agent can query directly for session forensics, per-tool attribution, forecasts, anomalies, and guardrails, @vk0/agent-cost-mcp is the narrow fit. If you mainly want a dashboard, a native quick check, or a general burn monitor, one of the alternatives may be the better first stop.
| Tool | Better fit when... | Where it appears stronger | Where @vk0/agent-cost-mcp is stronger |
|---|---|---|---|
ccusage | You want a polished terminal or TUI dashboard for Claude Code usage and burn tracking. | More mature human-facing dashboard experience and stronger operator-style monitoring UX. | MCP-first access for agents, richer per-tool/session forensics, and Cost Guard answers inside the conversation instead of in a separate dashboard. |
cctally | You want a local dashboard for Claude Code Pro/Max subscription limits — quota forecasts, cost-per-percent trends, and threshold alerts in a ccusage-compatible view. | More focused on subscription-quota tracking with a human-facing dashboard/TUI. | MCP-callable so an agent can pull per-tool, subagent, and branch attribution, anomalies, and guardrails inside the session instead of reading a dashboard. |
tokmon | You want to wrap a running OpenAI gpt-* program and watch its live token cost in real time — tokmon has no Claude/Anthropic support, so it cannot monitor Claude Code sessions at all. | Real-time cost monitoring by proxying a program's OpenAI API calls while it runs. | Works with Claude Code out of the box, offline from local JSONL after the run, with per-tool/session forensics, pricing-aware math, and MCP-callable guardrails rather than live API proxying. |
| claude-usage | You want lightweight usage summaries or quick reporting from Claude usage data and do not need much agent-facing intervention logic. | Simpler reporting-first framing and lighter-weight usage snapshots. | More useful when the next question is which tool, branch, or retry loop caused the spend and whether the agent should stop or adjust behavior. |
| Claude-Code-Usage-Monitor | You primarily want monitor-style visibility into Claude Code usage patterns. | Better fit if passive monitoring is the job and detailed local forensics are secondary. | Stronger for local guardrails, subagent attribution, anomaly detection, and actionable follow-up inside the MCP loop. |
Token Analyzer MCP | You need a general MCP token-analysis utility across payloads, prompts, or message shapes. | Broader token-analysis framing not tied as tightly to Claude Code session logs. | More specific to real Claude Code JSONL spend analysis, pricing-aware cost math, and session-oriented Cost Guard workflows. |
CodeBurn | You care most about burn-rate or usage monitoring and alerting rather than offline session forensics. | Stronger when the main question is “am I burning too fast?” instead of “which branch, tool, or retry loop caused this?” | Better for local Cost Guard workflows, tool attribution, branch/subagent breakdowns, and detailed post-run cost debugging without cloud dependence. |
A few honest caveats:
- Built-in
/costor/usageis still the best answer if all you want is a quick native number. ccusage,cctally,claude-usage, or Claude-Code-Usage-Monitor may be the better choice if your main priority is a reporting-first, dashboard, or subscription-quota experience rather than deeper session forensics.CodeBurnortokmonmay be the better fit if live burn-rate monitoring or wrapping a running API program matters more than local post-run cost debugging detail — notetokmononly supports OpenAIgpt-*models and has no Claude Code or Anthropic support.@vk0/agent-cost-mcpis intentionally narrower: local Claude Code JSONL logs, pricing-aware cost analysis, MCP-callable outputs, and guardrail-style answers inside the agent loop.
Best fit: solo developers and small teams who want an agent to answer “where did my tokens go, which tool or branch caused it, is this pattern risky, and what should I change next?” without sending logs to a cloud service or opening a separate billing dashboard.
FAQ
No. Everything runs locally. The server parses JSONL files from your ~/.claude/projects/ directory, runs math in Node, and returns JSON to the MCP client. There is no telemetry, no analytics endpoint, no cloud sync. You can run it with your network disabled.
Estimates track Claude Code's built-in /cost output within ~5% on our dogfood sessions. The exact delta depends on the pricing table in src/pricing.ts and how complete the usage fields are in your session JSONL. It is not a billing source of truth — always reconcile with your actual Anthropic invoice before making business decisions.
Not yet. The parser currently targets Claude Code's JSONL session log format (~/.claude/projects/**/*.jsonl). Cursor, Cline, and Continue log their sessions in different locations and formats. PRs welcome — open an issue with a sample log shape.
No. No Anthropic API key, no npm token, no auth of any kind. The server is read-only over your local filesystem.
Both are supported. The package ships a bin entry (agent-cost-mcp <session.jsonl>) for one-off analysis from the terminal. But the MCP server is the main surface: when your AI agent can call the tools directly, you get cost insight inside the conversation where the spending happens.
No, by design. src/pricing.ts is a plain TypeScript module — predictable, auditable, forkable. When Anthropic publishes new rates, bump the constants and re-run. Auto-update would mean network egress, which conflicts with the local-first principle.
- Restart the client completely after editing the config file.
- Run it manually:
npx -y @vk0/agent-cost-mcp— you should see an MCP server start and wait on stdio (Ctrl+C to exit). If it errors, you have an install problem. - Check Claude Desktop logs:
~/Library/Logs/Claude/mcp*.log(macOS) or%APPDATA%\Claude\logs\mcp*.log(Windows). - Verify Node ≥18:
node --version. The package requires Node 18+.
Limitations
- Estimates, not billing. Costs are derived from per-turn usage fields × a local pricing table. Not a substitute for your Anthropic invoice.
- Pricing table is manual.
src/pricing.tsmust be updated when rates change (by design — no silent network calls). - Claude Code only. Cursor/Cline/Continue sessions are not parsed. Other clients may be added if there is demand.
- Local file discovery. The server reads files from a project path you provide. It does not query a live Claude Code runtime state.
- Structured JSON output. No rich dashboards, no charts, no web UI. That is a feature, not a bug — the MCP client is the UI.
- Cache-read awareness depends on source. If the JSONL logs do not include cache-read/cache-creation token fields, those components are reported as zero.
Standalone CLI
The same parser is exposed as a CLI for one-off analysis without an MCP client:
npx -y @vk0/agent-cost-mcp ~/.claude/projects/my-project/session.jsonl
npx -y @vk0/agent-cost-mcp session.jsonl --subagent subagent.jsonl
npx -y @vk0/agent-cost-mcp session.jsonl --watch --watch-interval 5
--watch keeps re-scanning the target session log on an interval and prints the refreshed compact summary, which is useful while an active coding session is still accumulating cost.
Outputs the same JSON the MCP get_session_cost tool returns.
Development
Clone the repo and run:
npm ci           # install deps
npm run build    # compile to dist/
npm test         # vitest unit tests
npm run lint     # tsc --noEmit
npm run smoke    # end-to-end MCP client smoke test
Stack: TypeScript, @modelcontextprotocol/sdk, Zod, Vitest.
Official MCP Registry recovery path
If npm/package metadata is already correct but the Official MCP Registry listing needs a bounded re-publish, trigger the dedicated GitHub Actions workflow instead of creating a new tag or rerunning the full release flow:
gh workflow run registry-republish.yml --repo vk0dev/agent-cost-mcp
This workflow republishes server.json to the Official MCP Registry via GitHub OIDC only. It does not publish to npm and does not create a new release.
Changelog
See CHANGELOG.md. This project follows semantic versioning from v1.0.0 onwards.
Contributing
Issues and PRs welcome at github.com/vk0dev/agent-cost-mcp. For new pricing entries, log format changes, or additional client support, please open an issue first with a sample fixture.
License
MIT © vk0.dev
Reviews
No reviews yet
Be the first to review this server!
More Developer Tools MCP Servers
Git
Freeby Modelcontextprotocol · Developer Tools
Read, search, and manipulate Git repositories programmatically
Fetch
Freeby Modelcontextprotocol · Developer Tools
Web content fetching and conversion for efficient LLM usage
Worldmonitor
Freeby Koala73 · Developer Tools
Live markets, conflicts, country risk, chokepoints, energy, and China decision signals. 90 tools.
Paperclip
Freeby Paperclipai · Developer Tools
Trending hip-hop artist momentum scores across four cultural dimensions.
Toleno
Freeby Toleno · Developer Tools
Toleno Network MCP Server — Manage your Toleno mining account with Claude AI using natural language.
mcp-creator-python
Freeby mcp-marketplace · Developer Tools
Create, build, and publish Python MCP servers to PyPI — conversationally.